Break-even ROAS: the math every e-commerce store should do before raising budget
Break-even ROAS is 1 divided by contribution margin. See how to calculate it with shipping, taxes and returns, and when a ROAS of 3 loses money.
Contents
Break-even ROAS is the lowest return on ad spend (ROAS) at which advertising still pays for itself. The math is 1 divided by the contribution margin, which is the share of each sold dollar left after the variable costs of the sale. If 36.1% is left over, break-even ROAS is 2.77. With that margin, any ROAS below it, however good it looks in the dashboard, loses money for the business.
ROAS measures revenue, not profit
Google Ads' own documentation shows the definition with a shoe store example: the goal is US$ 5 in sales for every US$ 1 spent on ads, and the math is sales ÷ spend × 100%, which gives a 500% target ROAS. It is a ratio between conversion value and spend. No business cost enters it.
That explains a common mistake: two products with the same ROAS can have opposite results. A product with a 60% margin and another with a 20% margin can both show a ROAS of 3. For the first, advertising made a profit. For the second, it made a loss. The dashboard shows the same number.
So the question before raising budget is not "is the ROAS good?" but "is the ROAS above my break-even point?".
Contribution margin: what goes into the math
Contribution margin is the sale's revenue minus the variable costs, meaning the ones that exist only because the sale happened. Everything you pay with or without a sale (rent, salaries, tools) stays out, and so does advertising itself, which is what we are testing.
For an e-commerce store, the most common items are:
- Returns and cancellations: revenue you do not keep. Use the real rate from recent months.
- Product cost: what it cost to buy or make what was sold.
- Sales taxes: they depend on your tax regime and the product. Get the percentage from your accountant; do not use a generic number.
- Payment fee: the commission charged by the gateway or card processor.
- Shipping you pay: what the store absorbs, not what the customer pays.
If you offer installments with early receipt of funds, or pay sales commissions per sale, those costs are variable too and belong on the list.
A hypothetical example, step by step
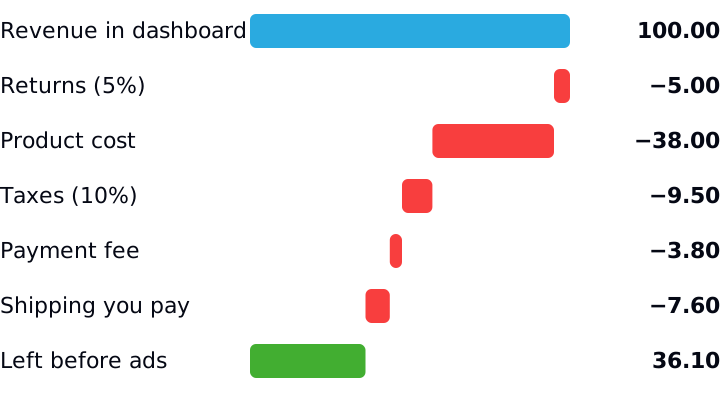
The numbers below are made up to show the math. Take R$ 100 of revenue that the ads dashboard attributes to campaigns and assume these rates:
Revenue in dashboard
- Rule
- —
- Amount (R$)
- 100.00
Returns and cancellations
- Rule
- 5% of 100
- Amount (R$)
- −5.00
Revenue kept
- Rule
- 100 − 5
- Amount (R$)
- 95.00
Product cost
- Rule
- 40% of 95
- Amount (R$)
- −38.00
Sales taxes
- Rule
- 10% of 95
- Amount (R$)
- −9.50
Payment fee
- Rule
- 4% of 95
- Amount (R$)
- −3.80
Shipping paid by the store
- Rule
- 8% of 95
- Amount (R$)
- −7.60
Left before advertising
- Rule
- 95 − 58.90
- Amount (R$)
- 36.10
| Item | Rule | Amount (R$) |
|---|---|---|
| Revenue in dashboard | — | 100.00 |
| Returns and cancellations | 5% of 100 | −5.00 |
| Revenue kept | 100 − 5 | 95.00 |
| Product cost | 40% of 95 | −38.00 |
| Sales taxes | 10% of 95 | −9.50 |
| Payment fee | 4% of 95 | −3.80 |
| Shipping paid by the store | 8% of 95 | −7.60 |
| Left before advertising | 95 − 58.90 | 36.10 |
Of every R$ 100 the dashboard shows, R$ 36.10 is left before paying for the ad. The contribution margin is 36.1%.
The formula: 1 divided by the margin
If each R$ 1 of revenue leaves R$ 0.361 before advertising, ads only pay for themselves when each R$ 1 spent brings back at least R$ 1 of contribution. That happens when revenue is at least 1 ÷ 0.361 times the spend:
Break-even ROAS = 1 ÷ contribution margin = 1 ÷ 0.361 ≈ 2.77
Checking: with R$ 1,000 of spend and a ROAS of 2.77, revenue is R$ 2,770. Contribution is 2,770 × 0.361 = R$ 999.97, practically the R$ 1,000 spent. Result: zero.
In Google Ads, the ROAS target is entered as a percentage, as in the documentation's 500% example. The break-even of 2.77 becomes a 277% target.
The table below shows how the break-even point rises as margin falls:
20%
- Break-even ROAS
- 5.00
- Google Ads target
- 500%
25%
- Break-even ROAS
- 4.00
- Google Ads target
- 400%
30%
- Break-even ROAS
- 3.33
- Google Ads target
- 333%
36.1%
- Break-even ROAS
- 2.77
- Google Ads target
- 277%
40%
- Break-even ROAS
- 2.50
- Google Ads target
- 250%
50%
- Break-even ROAS
- 2.00
- Google Ads target
- 200%
60%
- Break-even ROAS
- 1.67
- Google Ads target
- 167%
| Contribution margin | Break-even ROAS | Google Ads target |
|---|---|---|
| 20% | 5.00 | 500% |
| 25% | 4.00 | 400% |
| 30% | 3.33 | 333% |
| 36.1% | 2.77 | 277% |
| 40% | 2.50 | 250% |
| 50% | 2.00 | 200% |
| 60% | 1.67 | 167% |
The relationship is a curve: a 10-point drop in margin, from 30% to 20%, raises break-even from 3.33 to 5.00. A Black Friday discount, which cuts margin, can push break-even up more sharply than it seems.
What each dashboard ROAS yields in money
With break-even at 2.77, an account that spends R$ 20,000 a month produces these results at each ROAS (hypothetical, with the same 36.1% margin):
2.0
- Revenue
- R$ 40,000
- Contribution
- R$ 14,440
- Result after advertising
- −R$ 5,560
2.5
- Revenue
- R$ 50,000
- Contribution
- R$ 18,050
- Result after advertising
- −R$ 1,950
2.77
- Revenue
- R$ 55,400
- Contribution
- R$ 20,000
- Result after advertising
- ≈ R$ 0
3.0
- Revenue
- R$ 60,000
- Contribution
- R$ 21,660
- Result after advertising
- +R$ 1,660
4.0
- Revenue
- R$ 80,000
- Contribution
- R$ 28,880
- Result after advertising
- +R$ 8,880
| Dashboard ROAS | Revenue | Contribution | Result after advertising |
|---|---|---|---|
| 2.0 | R$ 40,000 | R$ 14,440 | −R$ 5,560 |
| 2.5 | R$ 50,000 | R$ 18,050 | −R$ 1,950 |
| 2.77 | R$ 55,400 | R$ 20,000 | ≈ R$ 0 |
| 3.0 | R$ 60,000 | R$ 21,660 | +R$ 1,660 |
| 4.0 | R$ 80,000 | R$ 28,880 | +R$ 8,880 |
A ROAS of 3 looks like a good campaign and earns R$ 1,660 in a month with R$ 20,000 of budget. A ROAS of 2.5, which many people would call acceptable, loses R$ 1,950. The 0.5-point difference in ROAS is worth more than R$ 3,600.
From break-even to profit: the target ROAS
Breaking even does not pay fixed costs or the team. To have something left over, define how much of revenue you want to keep after advertising and subtract it from the margin.
Target ROAS = 1 ÷ (contribution margin − desired profit as a share of revenue)
With a 36.1% margin and a goal of keeping 10% of revenue after advertising, ads can consume at most 26.1% of revenue. The target ROAS is 1 ÷ 0.261 ≈ 3.83.
Checking with the R$ 20,000 budget: revenue of R$ 76,600 (20,000 × 3.83), contribution of R$ 27,653 (76,600 × 0.361, rounded) and R$ 7,653 left after advertising, almost the 10% of R$ 76,600 (R$ 7,660). The small difference comes from rounding 3.83.
How to use the number on the platforms
Google Ads asks you to set values for the conversions you track before using a ROAS target strategy. The conversion values page also says that target ROAS bidding aims to maximize conversion value, citing sales revenue and profit margins as examples. In other words, the value you report is your choice.
There are two ways to use this:
- 1.Conversion value as revenue (the most common setup). The dashboard ROAS is revenue-based, and the target you set is your break-even ROAS or the target ROAS calculated above.
- 2.Conversion value as margin. You send the contribution, not the revenue, as the conversion value. Then the dashboard ROAS is already "profit over spend," and break-even becomes 1.0 (100%). This requires your system to calculate the margin of each sale and send it as the conversion value.
Either way, write down in the client report which of the two you use. Comparing a month of revenue-based ROAS with one based on margin is the same mistake as comparing different attribution windows.
Break-even is a floor, not a promise
Three caveats keep the math honest:
- The dashboard may count sales that would have happened anyway. Dashboard ROAS is attributed, not necessarily incremental. Suppose, hypothetically, that only 70% of attributed revenue was caused by the ad. To break even, the dashboard needs to show 2.77 ÷ 0.7 ≈ 3.96. The article on platform, blended and CRM ROAS shows how to cross-check the number against real revenue.
- The first purchase may not be the whole picture. If the customer buys again, the first order may break even on purpose. But only treat this as a strategy if you measure repeat purchases, not if you merely hope for them.
- The margin changes. Discounts, supplier price increases, shipping and return rates all move break-even. Recalculate every month and at every promotion.
Where Relator comes in
Relator matches the deals won in HubSpot or RD Station CRM to the campaign that brought the lead and divides the revenue by spend, to show real ROAS next to platform ROAS. That is the revenue you compare with your break-even point. Contribution margin remains your own number, coming from finance.
How to apply
- 1.Gather the variable costs of the last 3 to 6 months with finance: returns, product, taxes, payment fee and shipping.
- 2.Build the table per R$ 100 of revenue, as in the example, and calculate the contribution margin.
- 3.Divide 1 by the margin to get break-even ROAS. Then set the desired profit and calculate the target ROAS.
- 4.Use one margin per product category when they differ a lot; a single ROAS for the whole catalog hides products that lose money.
- 5.Put break-even and target at the top of the client report, next to the current ROAS.
- 6.If you use a ROAS target in Google Ads, convert the value to a percentage and check whether conversion values are in revenue or margin.
- 7.Recalculate when price, discount, shipping or return rate change.
Sources
Checked on October 12, 2026. Left out, because we found no definition in Meta's official documentation, is how purchase ROAS is calculated in Meta's tools. The break-even formula is arithmetic and does not depend on any platform.
- Google Ads Help, About target ROAS bidding: shoe store example with a 500% target (sales ÷ spend × 100%) and the requirement to set values for tracked conversions.
- Google Ads Help, Conversion values: target ROAS bidding maximizes conversion value, with sales revenue and profit margins as examples.
This article is also available as Markdown, for agents and LLMs: view .md version