Which metric to check first: ROAS, CPA or margin? It depends on your business model
A ROAS of 3 can lose money and the cheapest CPL can bring the most expensive customer. Pick your main metric by how the business makes money.

Contents
The first metric to check is the one that measures the business result, and it changes with the model: in e-commerce it is ROAS compared with the break-even ROAS of your margin; in lead generation it is cost per sale (or per opportunity), not cost per lead. CTR, CPM and conversion rate come later, only to explain why the main number went up or down.
Start with the number that pays the bills
Every ad account has dozens of columns. The common mistake is treating them all as equally important and optimizing whichever one improved most easily. Organize metrics into three layers and always read them top to bottom:
- 1.Business metric: profit, contribution margin after media, revenue, number of sales. This is what the business owner or the finance team recognizes.
- 2.Channel efficiency: ROAS, cost per acquisition (CPA), cost per sale. It tells you how much each unit of money invested in a channel or campaign brings back.
- 3.Diagnostics: CPM (cost per thousand impressions), CTR (click-through rate), conversion rate (CVR), average order value. They explain movement in the layers above. They are not targets.
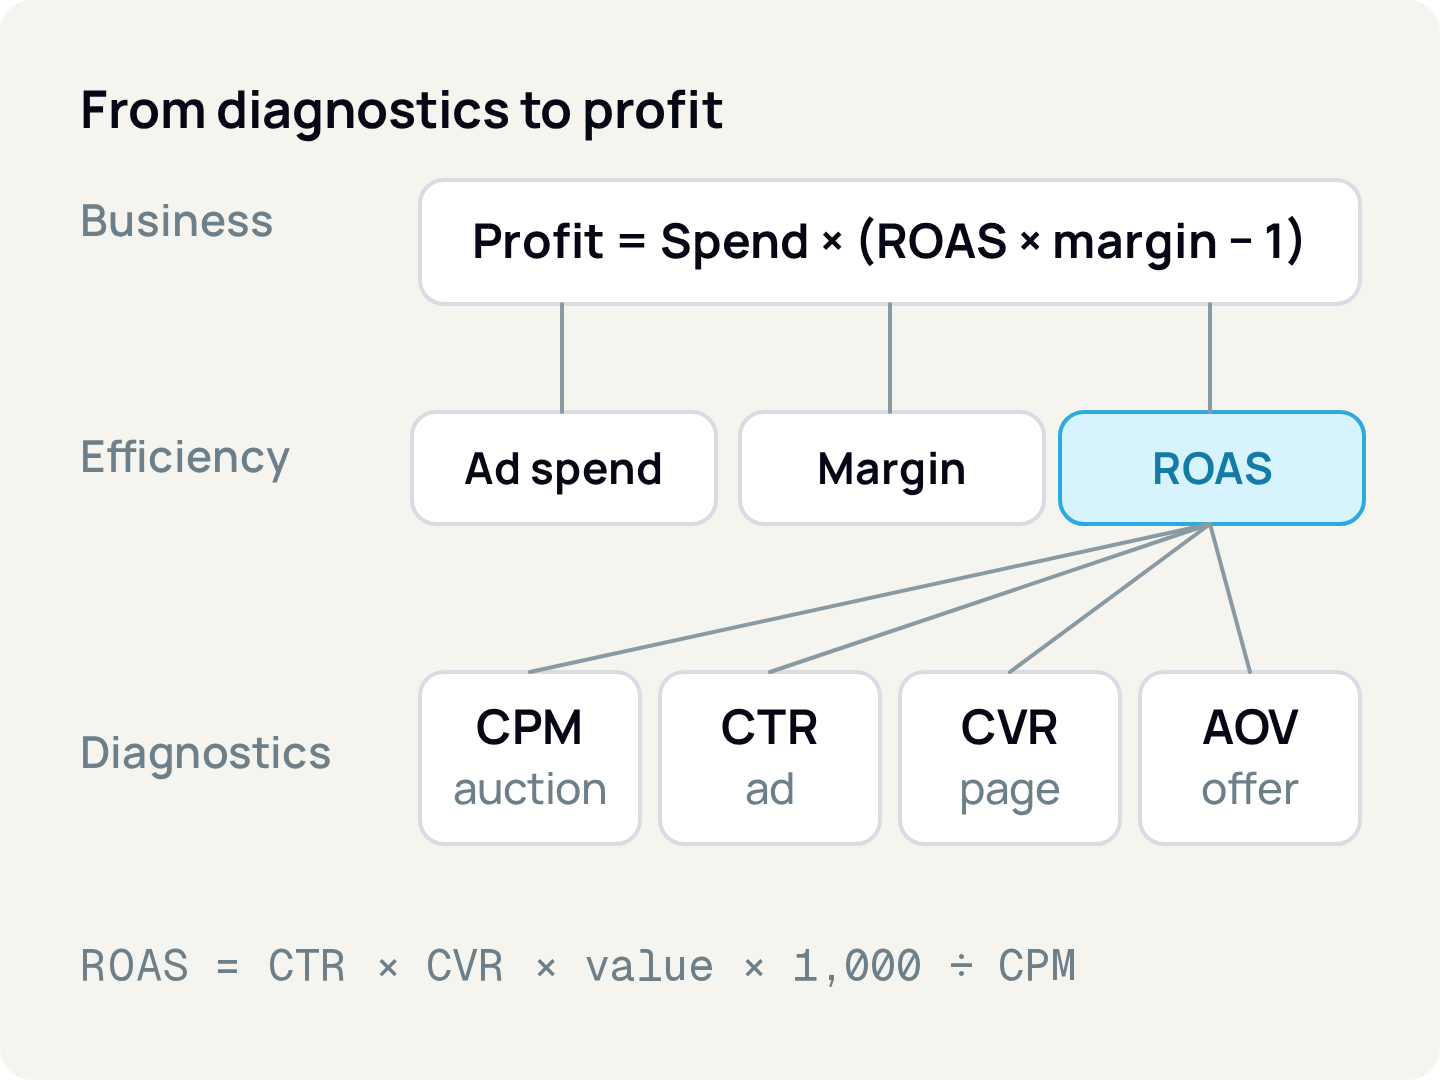
The relationship between the layers is arithmetic. A campaign's revenue is impressions × CTR × conversion rate × average order value. Spend is impressions × CPM ÷ 1,000. Divide one by the other and impressions cancel out:
ROAS = CTR × conversion rate × average order value × 1,000 ÷ CPMThat is why a CTR that doubles is not a win by itself: if the conversion rate halves in the same period, ROAS stays the same. A diagnostic metric only matters for its effect on the layers above.
E-commerce: ROAS only makes sense next to margin
Meta and Google Ads calculate ROAS the same way: attributed conversion value divided by amount spent. Google shows the ROAS target as a percentage (5 in sales for every 1 invested is a 500% target ROAS). Neither of them knows what the product you sold cost you. Meta's own help center says your ROAS goal depends on your profit margins.
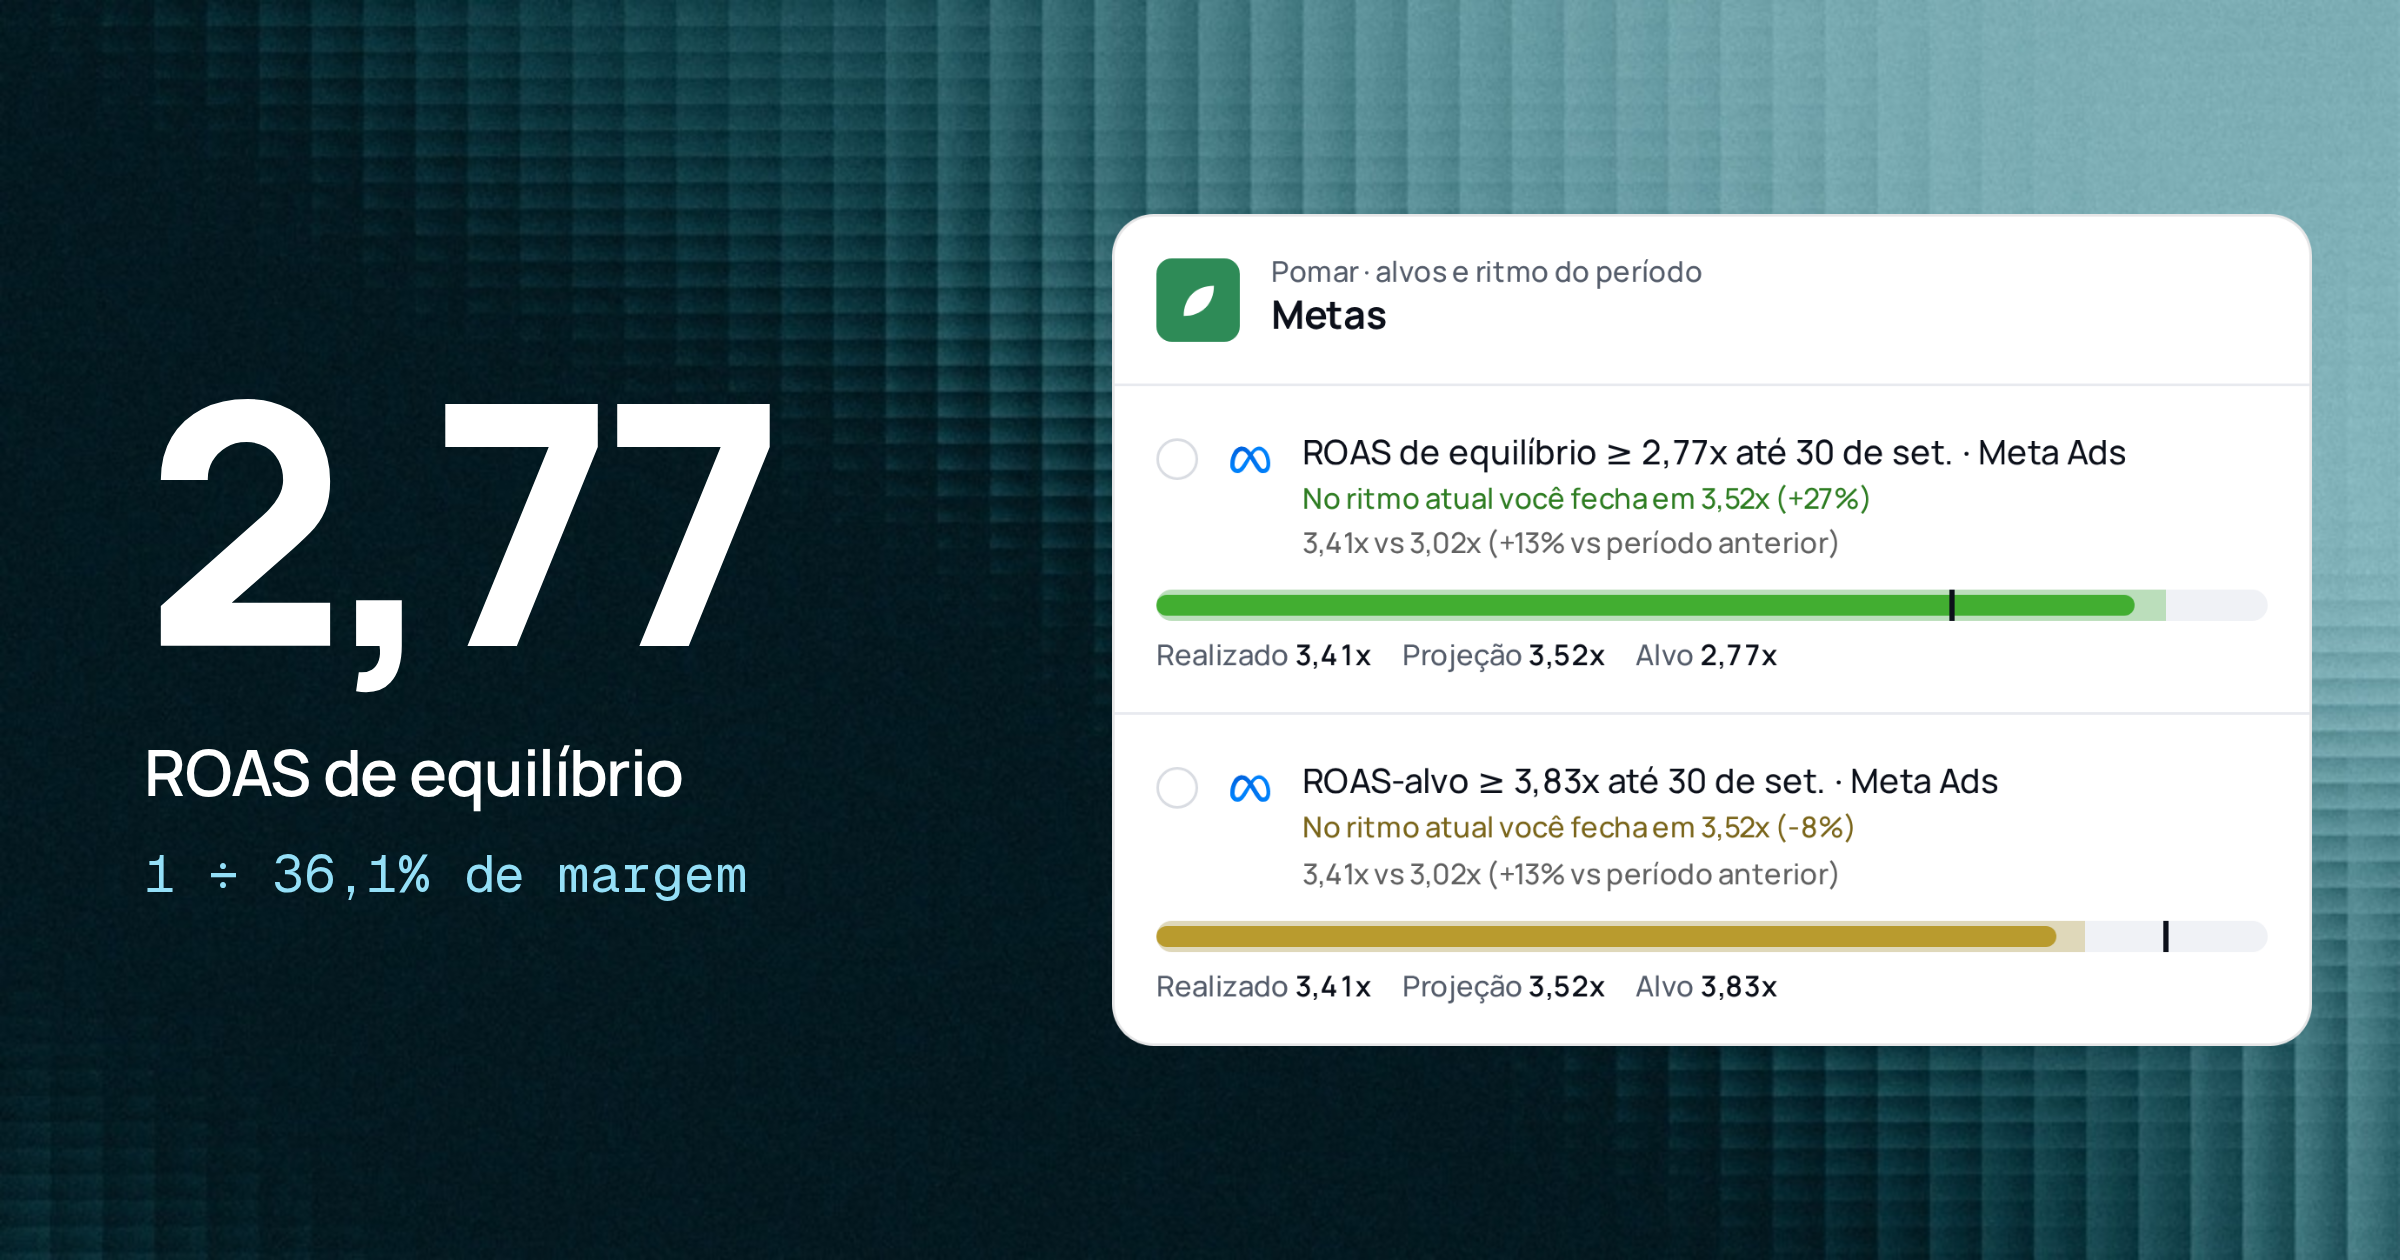
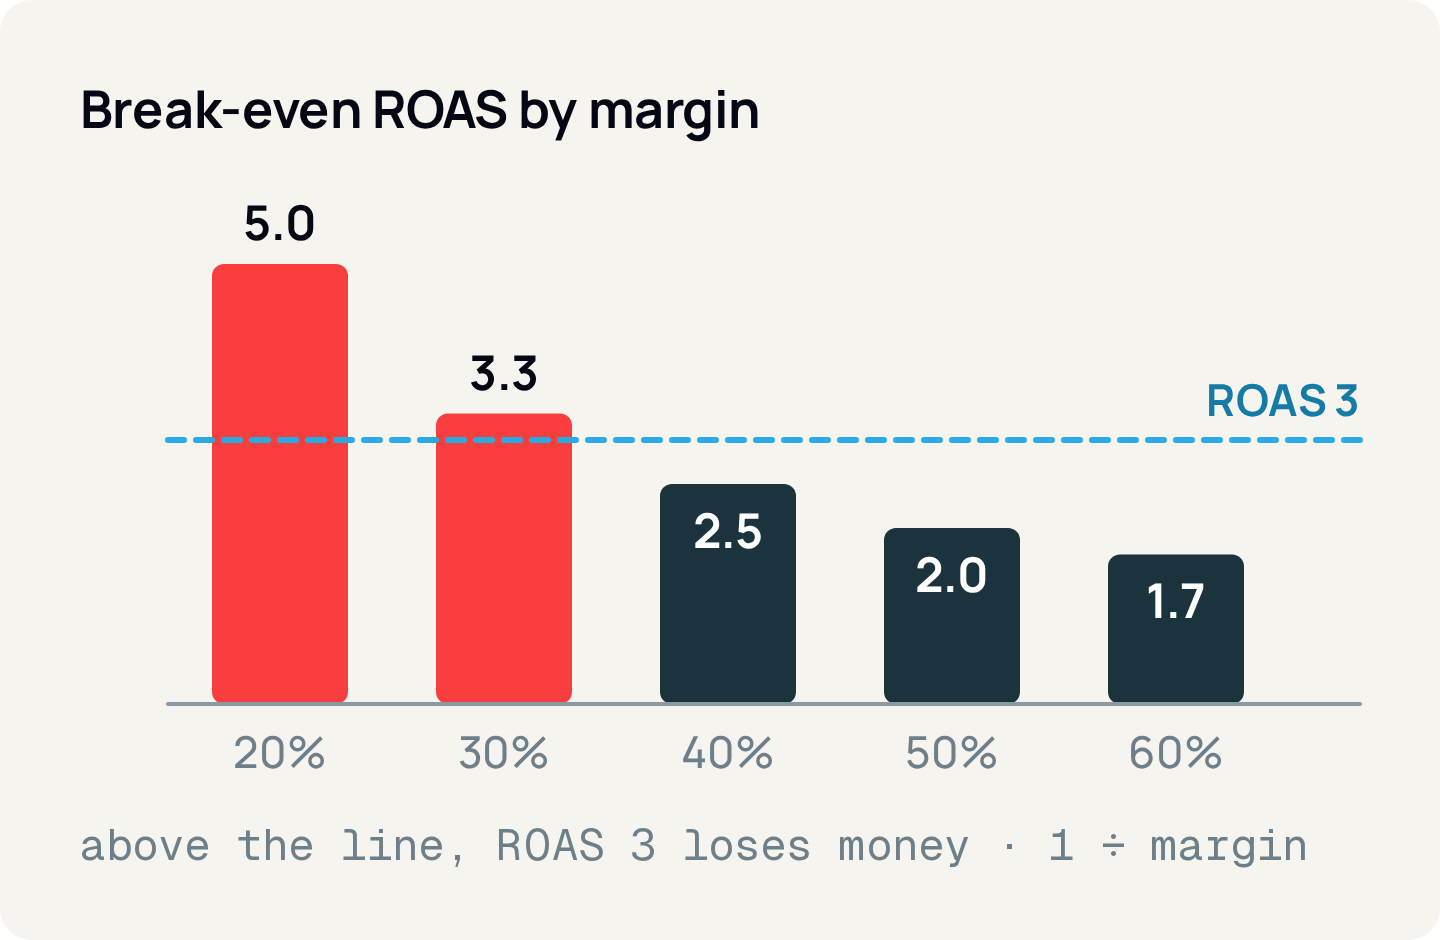
The right question is: which ROAS pays for the product, shipping, fees and media, with nothing left over and nothing missing? That is the break-even ROAS:
Break-even ROAS = 1 ÷ contribution marginContribution margin here is what is left of each unit sold after product cost, sales taxes, subsidized shipping, payment fees and returns, before media. If 0.40 of each unit is left, you need 2.50 in revenue to pay for each 1 of ads. Below that, every sale attributed to the campaign takes money out of the bank.
Why a ROAS of 3 can lose money
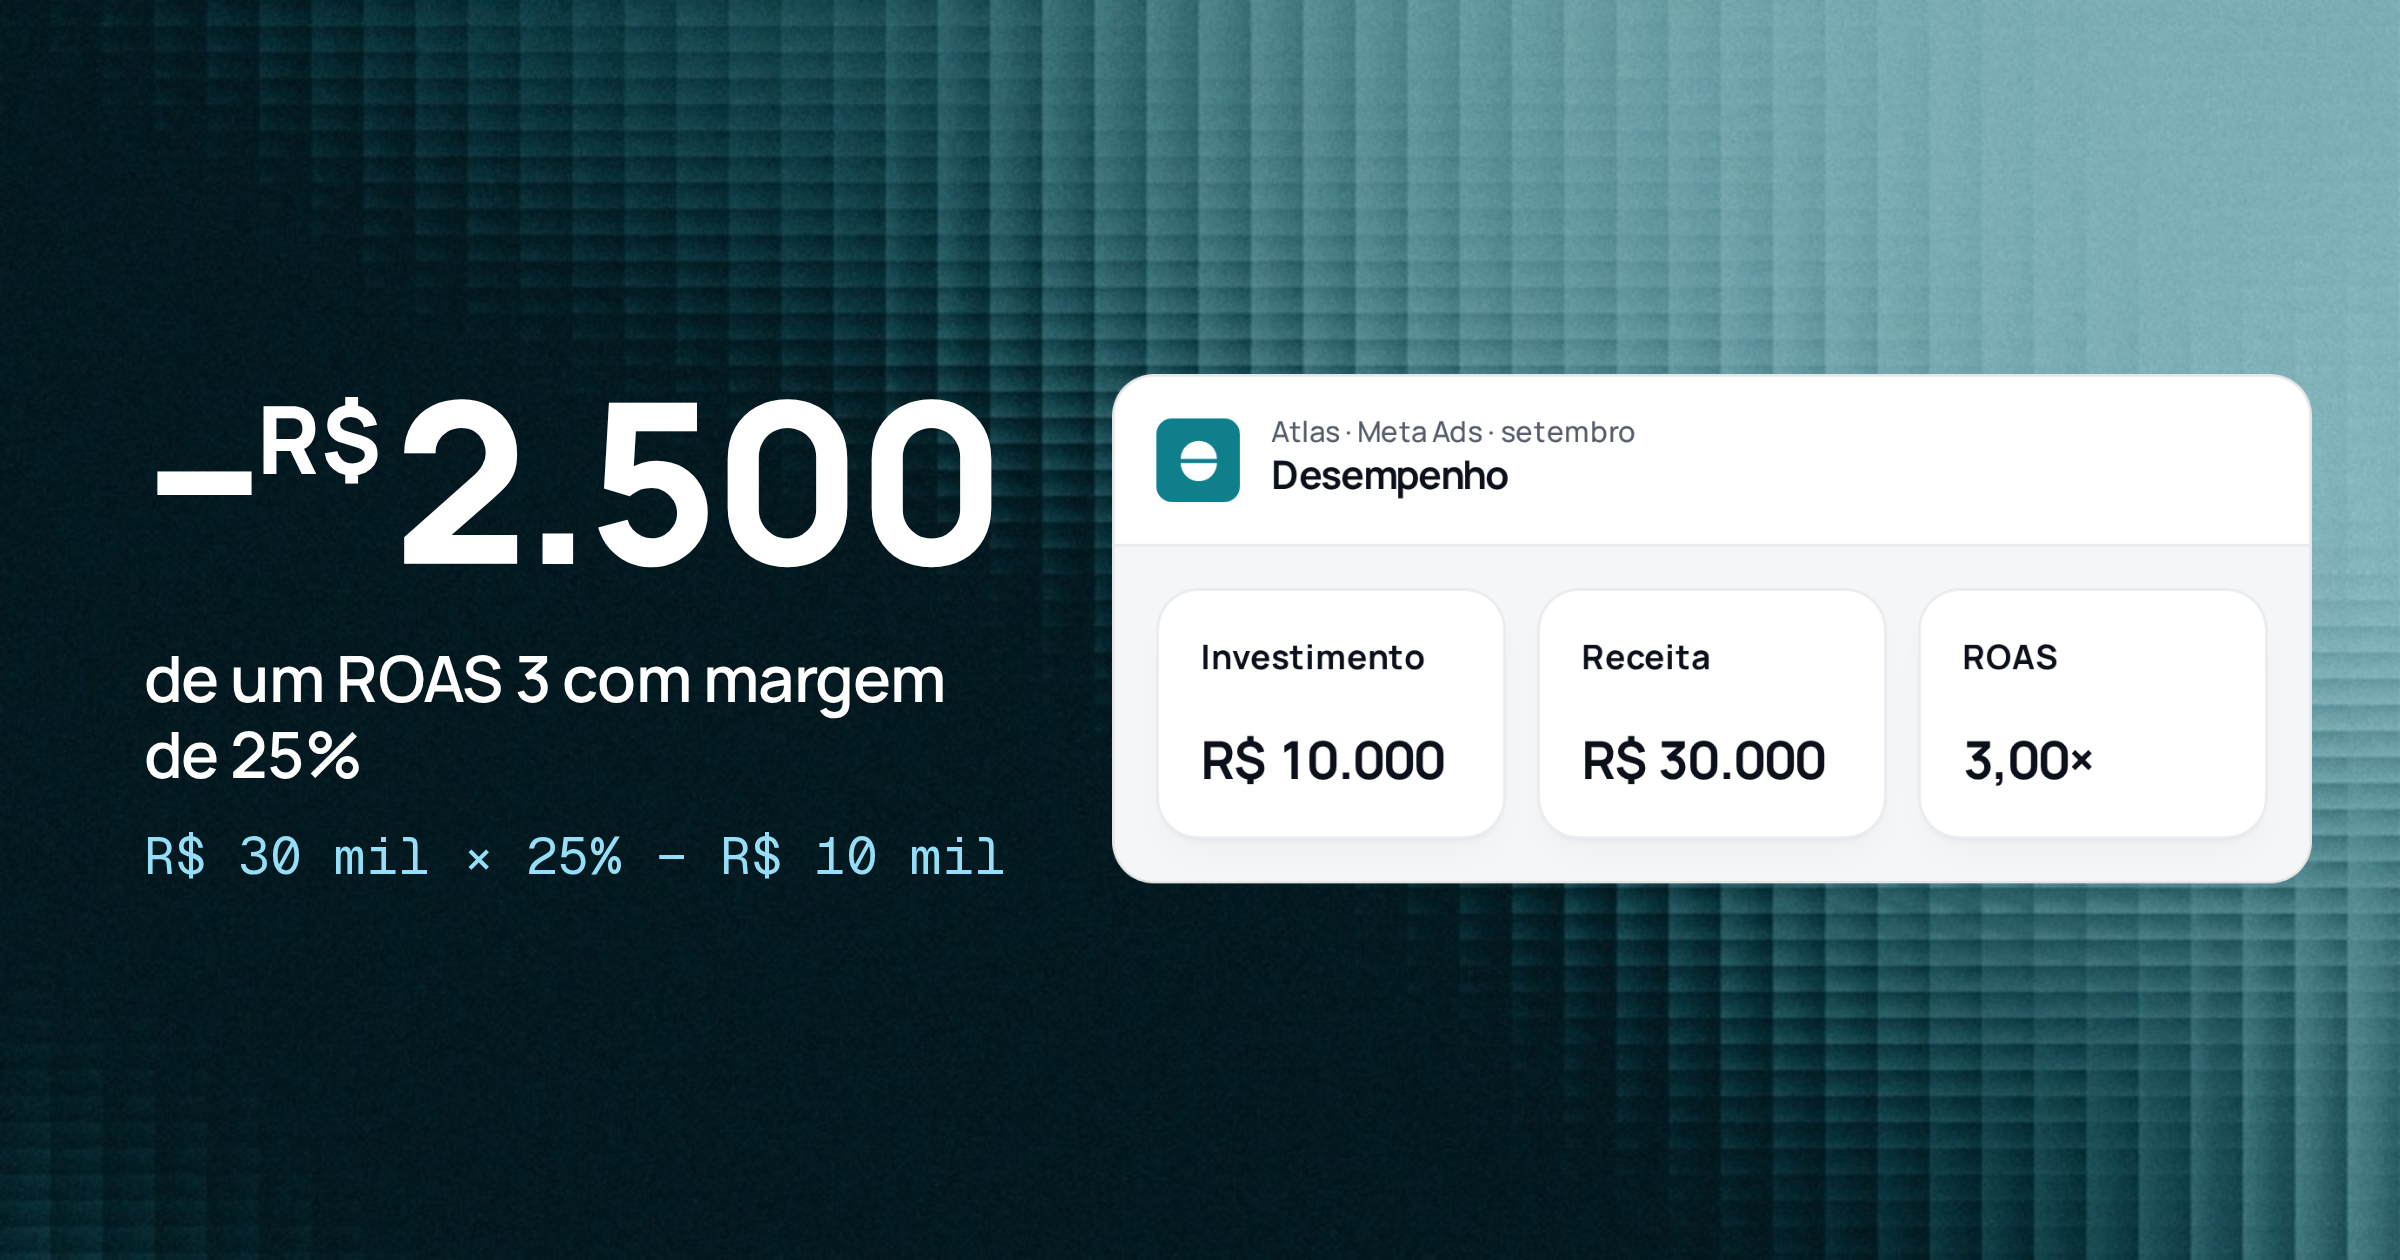
A hypothetical example with three Brazilian stores that each invest R$ 10,000 a month and reach the same ROAS of 3, that is, R$ 30,000 in attributed revenue. The target ROAS in the last column is the one that leaves 10% of revenue as profit after media: 1 ÷ (margin − 0.10).
Private-label cosmetics
- Contribution margin
- 60%
- Break-even ROAS
- 1.67
- Result at ROAS 3
- +R$ 8,000
- ROAS for a 10% profit on revenue
- 2.0
Fashion
- Contribution margin
- 40%
- Break-even ROAS
- 2.50
- Result at ROAS 3
- +R$ 2,000
- ROAS for a 10% profit on revenue
- 3.33
Electronics reseller
- Contribution margin
- 25%
- Break-even ROAS
- 4.00
- Result at ROAS 3
- −R$ 2,500
- ROAS for a 10% profit on revenue
- 6.67
| Store (hypothetical) | Contribution margin | Break-even ROAS | Result at ROAS 3 | ROAS for a 10% profit on revenue |
|---|---|---|---|---|
| Private-label cosmetics | 60% | 1.67 | +R$ 8,000 | 2.0 |
| Fashion | 40% | 2.50 | +R$ 2,000 | 3.33 |
| Electronics reseller | 25% | 4.00 | −R$ 2,500 | 6.67 |
The electronics store's math: R$ 30,000 × 25% = R$ 7,500 of margin, minus R$ 10,000 of media, gives R$ 2,500 negative. The platform dashboard shows the same ROAS of 3 in all three accounts. Only the margin tells you which one should grow spend and which one should cut.
Two adjustments make the math more honest. First, margin varies by product: if the catalog mixes 20% and 60% items, an average ROAS hides campaigns that only sell what does not make a profit. Google Ads lets you send cost of goods sold (COGS) in the Merchant Center feed and, with conversions with cart data, reports gross profit per campaign. Second, if the customer buys again, the first purchase does not have to pay for itself. Then the decision becomes acquisition cost versus customer value, as in lead generation.
Check MER as well
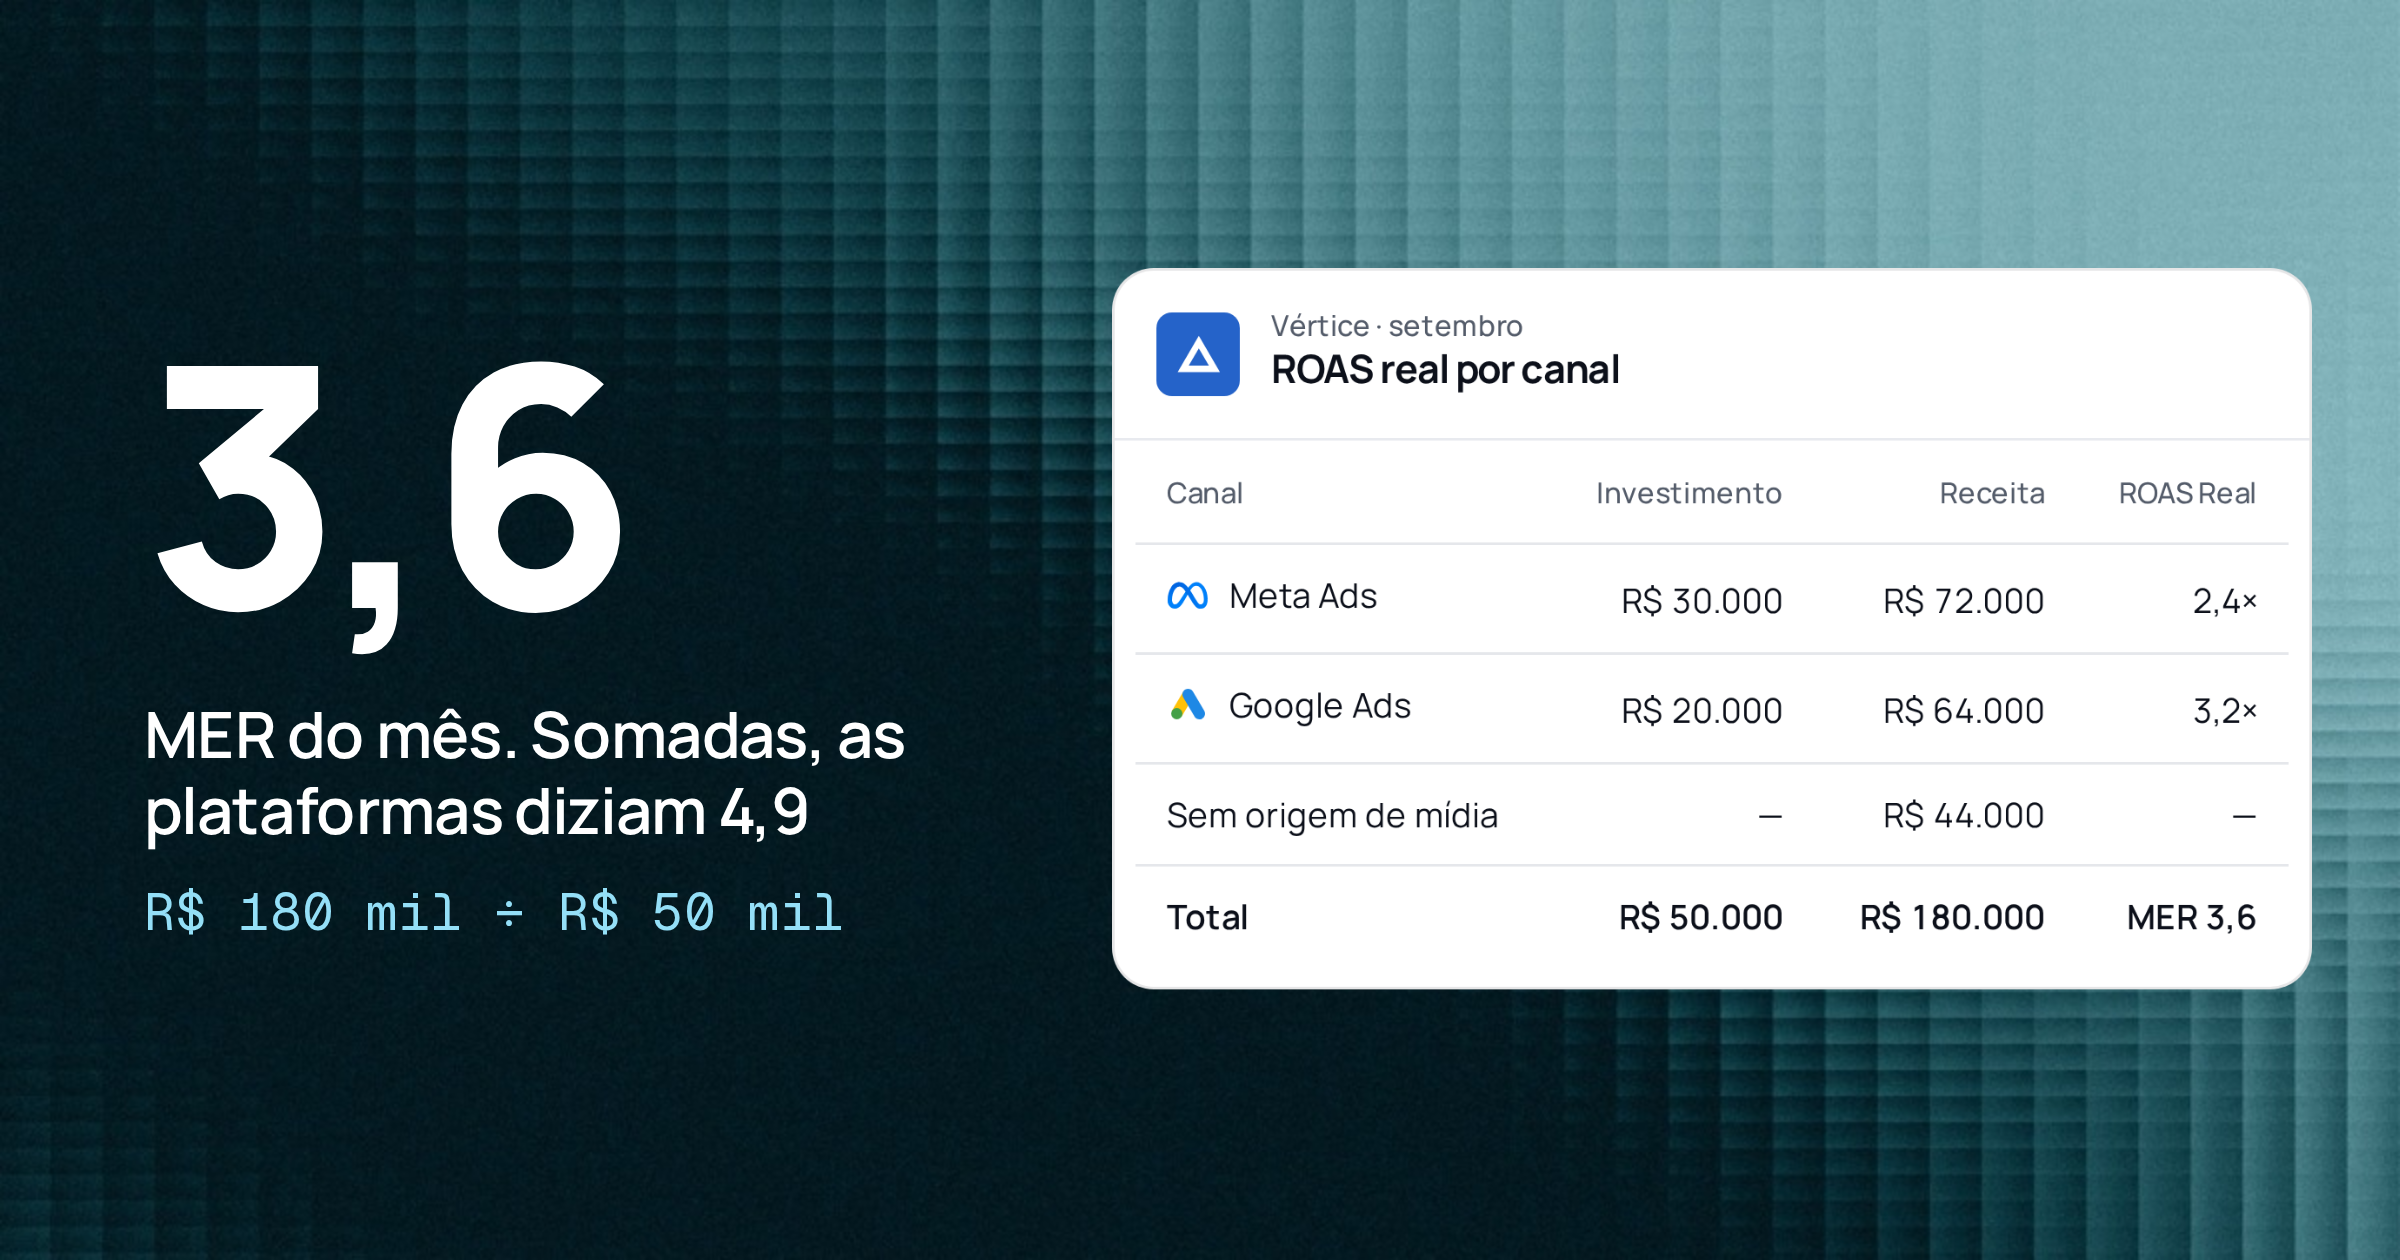
The platform's ROAS counts only the revenue it attributes to itself, inside its own attribution window. Adding up Meta and Google ROAS often counts the same sale twice. MER (marketing efficiency ratio) is the store's total revenue divided by total media spend for the period. It does not tell you which campaign worked, but it is the reality check: if every campaign's ROAS goes up and MER stays flat, media is taking credit for sales that would have happened anyway. Compare MER with the same break-even ROAS of your margin.
Lead generation: CPL is the most misleading metric in the funnel
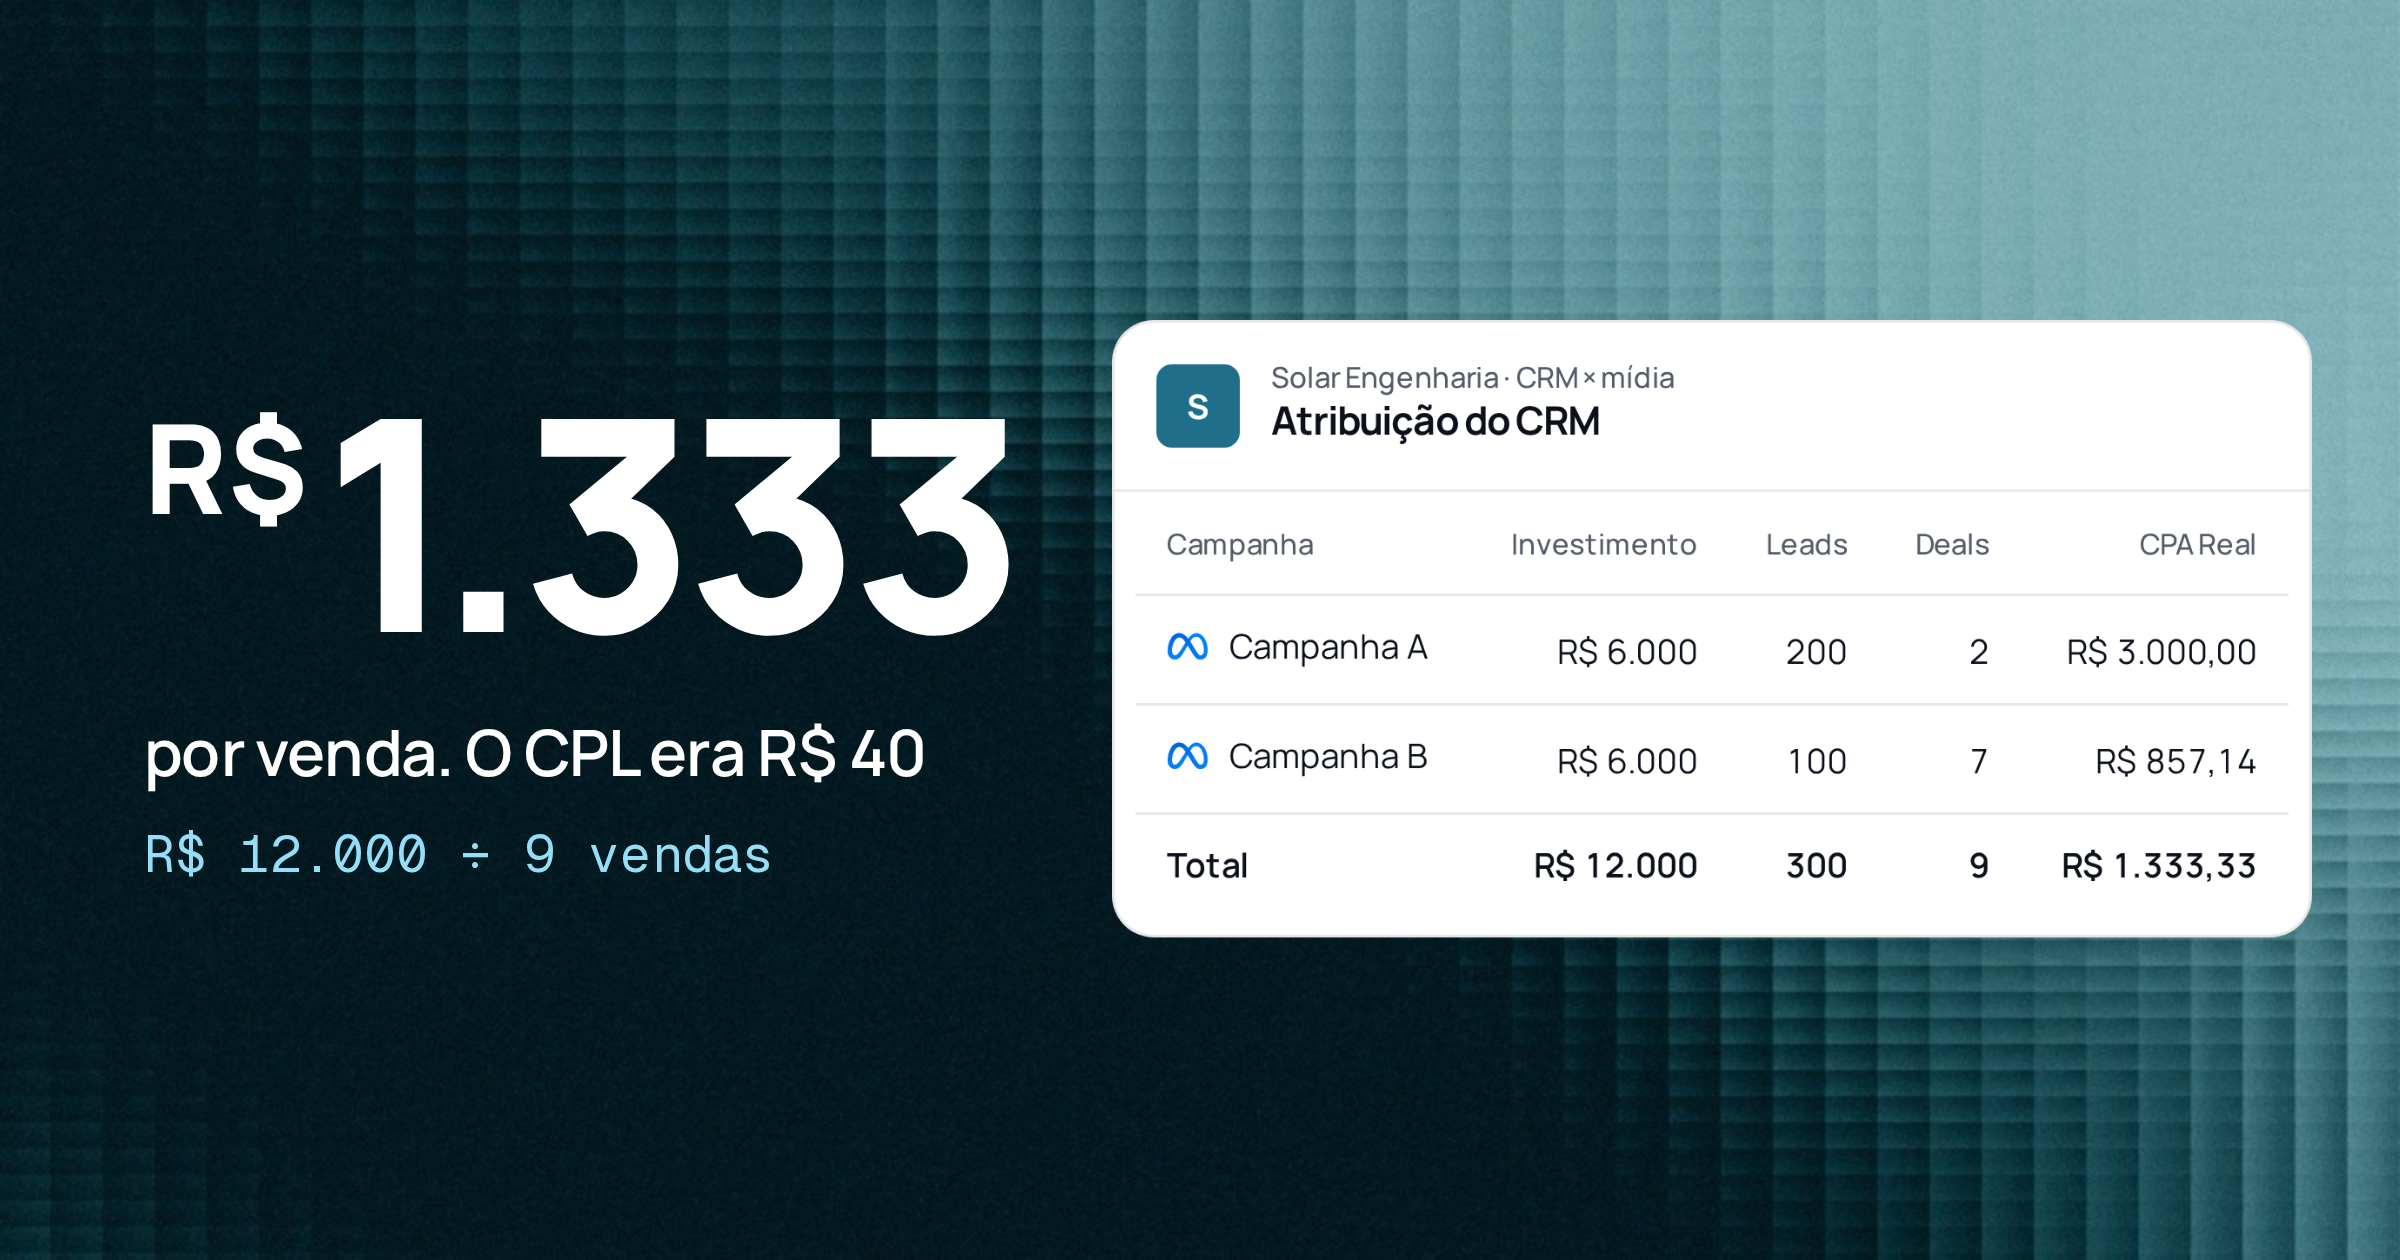
In services, B2B, education and real estate, the platform sees the form, not the contract. Optimizing for CPL pushes the algorithm toward people who fill out forms easily, who are not always the people who buy.
Hypothetical example: a company invests R$ 20,000 a month, split between two campaigns. The qualification and close rates come from the CRM.
A: short form, broad audience
- Spend
- R$ 10,000
- Leads
- 400
- CPL
- R$ 25.00
- Qualified leads
- 32 (8%)
- Sales
- 8 (25%)
- Cost per sale
- R$ 1,250
B: form with qualifying questions
- Spend
- R$ 10,000
- Leads
- 160
- CPL
- R$ 62.50
- Qualified leads
- 48 (30%)
- Sales
- 12 (25%)
- Cost per sale
- R$ 833
| Campaign (hypothetical) | Spend | Leads | CPL | Qualified leads | Sales | Cost per sale |
|---|---|---|---|---|---|---|
| A: short form, broad audience | R$ 10,000 | 400 | R$ 25.00 | 32 (8%) | 8 (25%) | R$ 1,250 |
| B: form with qualifying questions | R$ 10,000 | 160 | R$ 62.50 | 48 (30%) | 12 (25%) | R$ 833 |
By CPL, campaign A is 2.5 times better. By cost per sale, B brings customers 33% cheaper. Whoever cuts B to "lower CPL" makes the result worse.
Read the funnel in steps: cost per lead, per qualified lead, per opportunity and per sale. Then compare customer acquisition cost (CAC) with the value of the customer over time (LTV, lifetime value), always in margin and not in revenue. Continuing the example: if the customer pays R$ 500 a month, gross margin is 70% and the customer stays 12 months on average, LTV in margin is R$ 500 × 0.7 × 12 = R$ 4,200. Campaign B pays back the media cost of each sale in R$ 833 ÷ R$ 350 = 2.4 months; A, in 3.6 months. Remember this cost per sale only includes media. Full CAC adds the sales team and tools.
The sale arrives after the report
In B2B, today's lead may close in 30, 60 or 90 days. Platforms do not follow that on their own: on Meta, the available attribution windows go up to 7 days after the click. Two practical consequences:
- Evaluate campaigns by cohort: the sales from leads created in March, even if they close in May. Comparing May spend with May sales mixes different campaigns.
- Send CRM stages back to the platforms. Meta optimizes for quality leads with the CRM integration through the Conversions API (it requires at least 200 leads a month, daily uploads and a stage with a conversion rate between 1% and 40%). Google Ads does the same with enhanced conversions for leads, using qualified lead or converted lead as the goal.
Local business and WhatsApp: a conversation is not a customer
Clinics, schools, restaurants and local service providers often sell through WhatsApp. Meta counts "messaging conversations started": each time someone starts talking to the business from the ad after at least 7 days without messages. It is a good sign of interest, but it includes people who only ask for the price.
What moves the result is cost per appointment, per approved quote or per sale. To get there without an expensive system:
- Use one WhatsApp link per campaign, with an opening message that identifies the source.
- Ask the team to tag each conversation in three states: no reply, quote sent, closed.
- Once a week, divide each campaign's spend by its number of closed deals.
With little data, look at four-week trends, not one day.
Apps: the install is the CPL of the mobile world
In apps, cost per install (CPI) plays the role of CPL: it is cheap to measure and easy to optimize, but it does not pay the bills. The main metric is cost per paying user (or per user still active after 30 days) compared with the revenue that user generates within the period in which you want to recover the investment.
Use CTR, CPM and conversion rate to explain, not to decide
Diagnostic metrics answer "why". If cost per sale rose 20%, the tree shows where to look: did CPM go up (pricier auction, smaller audience), did CTR fall (tired creative) or did the conversion rate fall (page, price, stock, customer service)? Fix the cause and check whether the business metric recovered.
What does not work is turning diagnostics into targets. A CTR target rewards eye-catching ads that do not sell. A low-CPM target leads to cheap, poorly qualified audiences. Set targets only on the top two layers.
To match the CRM sale to the campaign, Relator Digital connects HubSpot or RD Station CRM, matches the lead to the campaign by gclid and UTM, and shows real ROAS by channel and by campaign, with revenue from won deals. You can also set ROAS, CPA, revenue or lead goals and track the month's pace.
How to apply
- 1.Write in one sentence how the business makes money: one-off sale, repeat purchase, subscription, contract, appointment.
- 2.Calculate the average contribution margin and, if you can, by product or service category.
- 3.In e-commerce, turn the margin into break-even ROAS (1 ÷ margin) and into a target ROAS with the profit you want (1 ÷ (margin − desired profit)). Use that number in your bid strategy, not last month's ROAS.
- 4.In lead generation, define in the CRM what a qualified lead, an opportunity and a sale are, and calculate cost per stage per campaign, by lead creation cohort.
- 5.Send those stages back to Meta and Google Ads, so the algorithm optimizes for what sells.
- 6.Track MER (or total cost per sale) every month as a check on each platform's metrics.
- 7.When the main metric changes, open the tree: CPM, CTR, conversion rate and order value. Only then change creative, audience or page.
Sources
- About Target ROAS bidding — Google Ads Help
- About conversions with cart data — Google Ads Help
- Provide cost of goods sold (COGS) to report on profit margins — Google Ads Help
- About enhanced conversions for leads — Google Ads Help
- Purchases ROAS (Return on Ad Spend) — Meta Business Help Center
- Return on Ad Spend — Meta Business Help Center
- About attribution setting — Meta Business Help Center
- Conversions API for CRM integration — Meta for Developers
- Messaging conversations started — Meta Business Help Center
About the author
João Vitor Moitinho
João Vitor Moitinho is the founder of Relator Digital. A computer engineer, he works on growth, measurement and martech, and writes here about what he learns building reports for performance agencies.
João Vitor Moitinho on LinkedInThis article is also available as Markdown, for agents and LLMs: view .md version