A client report is a product, not an attachment
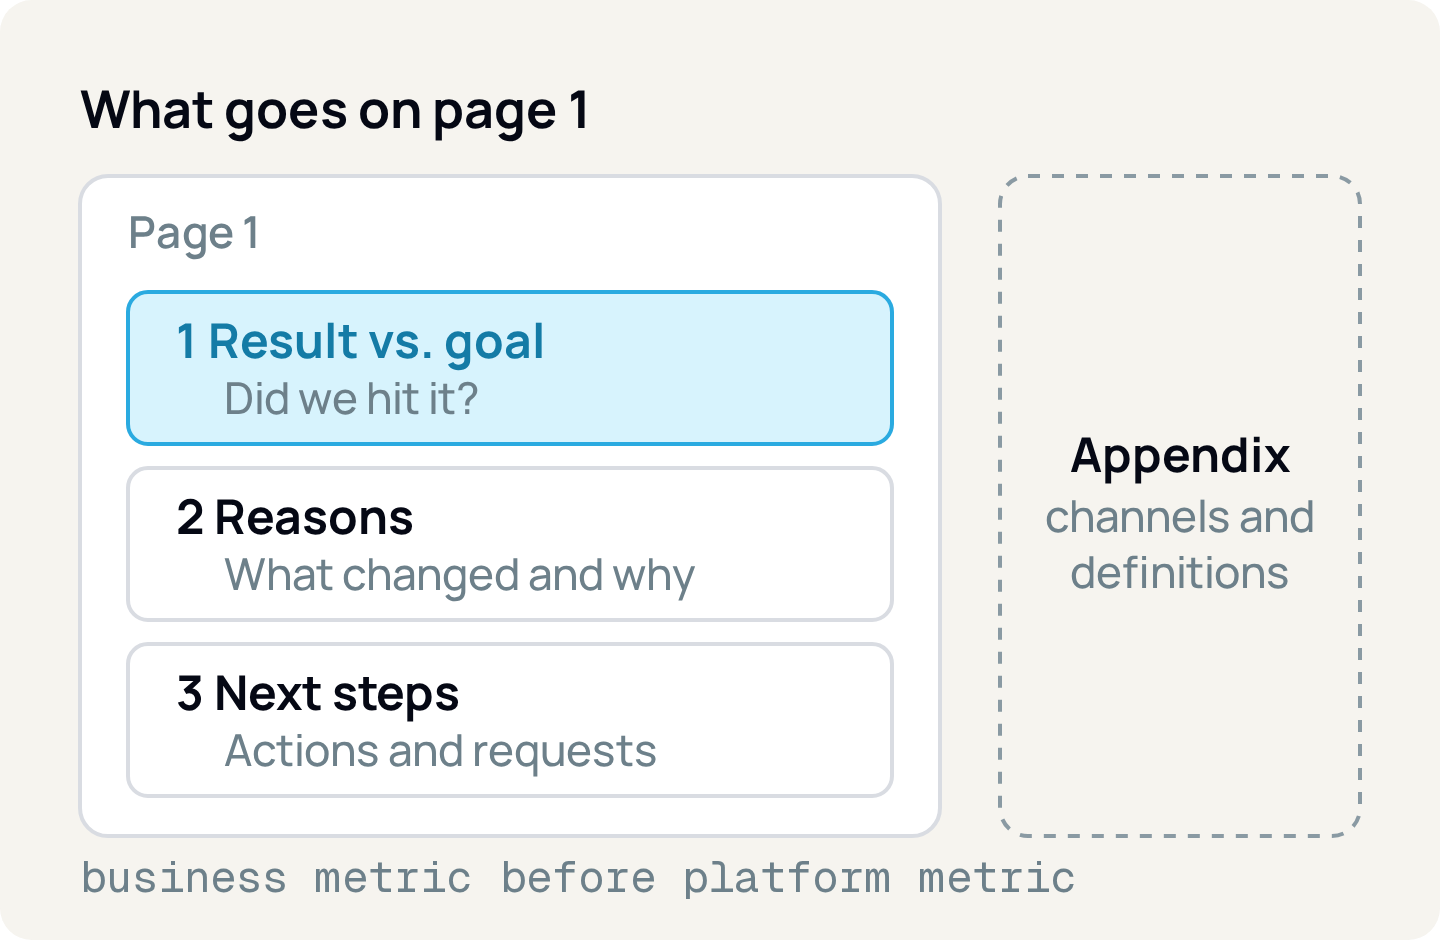
The monthly report answers three questions, in this order: did we hit the goal, why, and what comes next. See the structure, the ritual and common mistakes.

Contents
A client report works as a product when its first page answers three questions, in this order: did we hit the goal we agreed on? Why did the result turn out this way? What will we do next, and what do we need from the client? Everything else (charts by channel, campaign, creative) goes in the appendix, and the document goes out in the same format, on the same date and with the same definitions every month.
Clients don't buy charts, they buy decisions
Whoever hires the agency wants to know whether the money they invested turned into results and what happens next month. A PDF with 30 dashboard screenshots answers neither. It hands the interpretation work to the client, and someone who pays precisely to avoid that work notices.
Treating the report as a product means giving it a stable format, a defined audience (the client's decision-maker, not the agency's analyst), quality control before it goes out, and announced improvements instead of silent changes. For many decision-makers, the report is the service.
The three questions, in this order
Order matters because the decision-maker reads the beginning and decides whether to keep going.
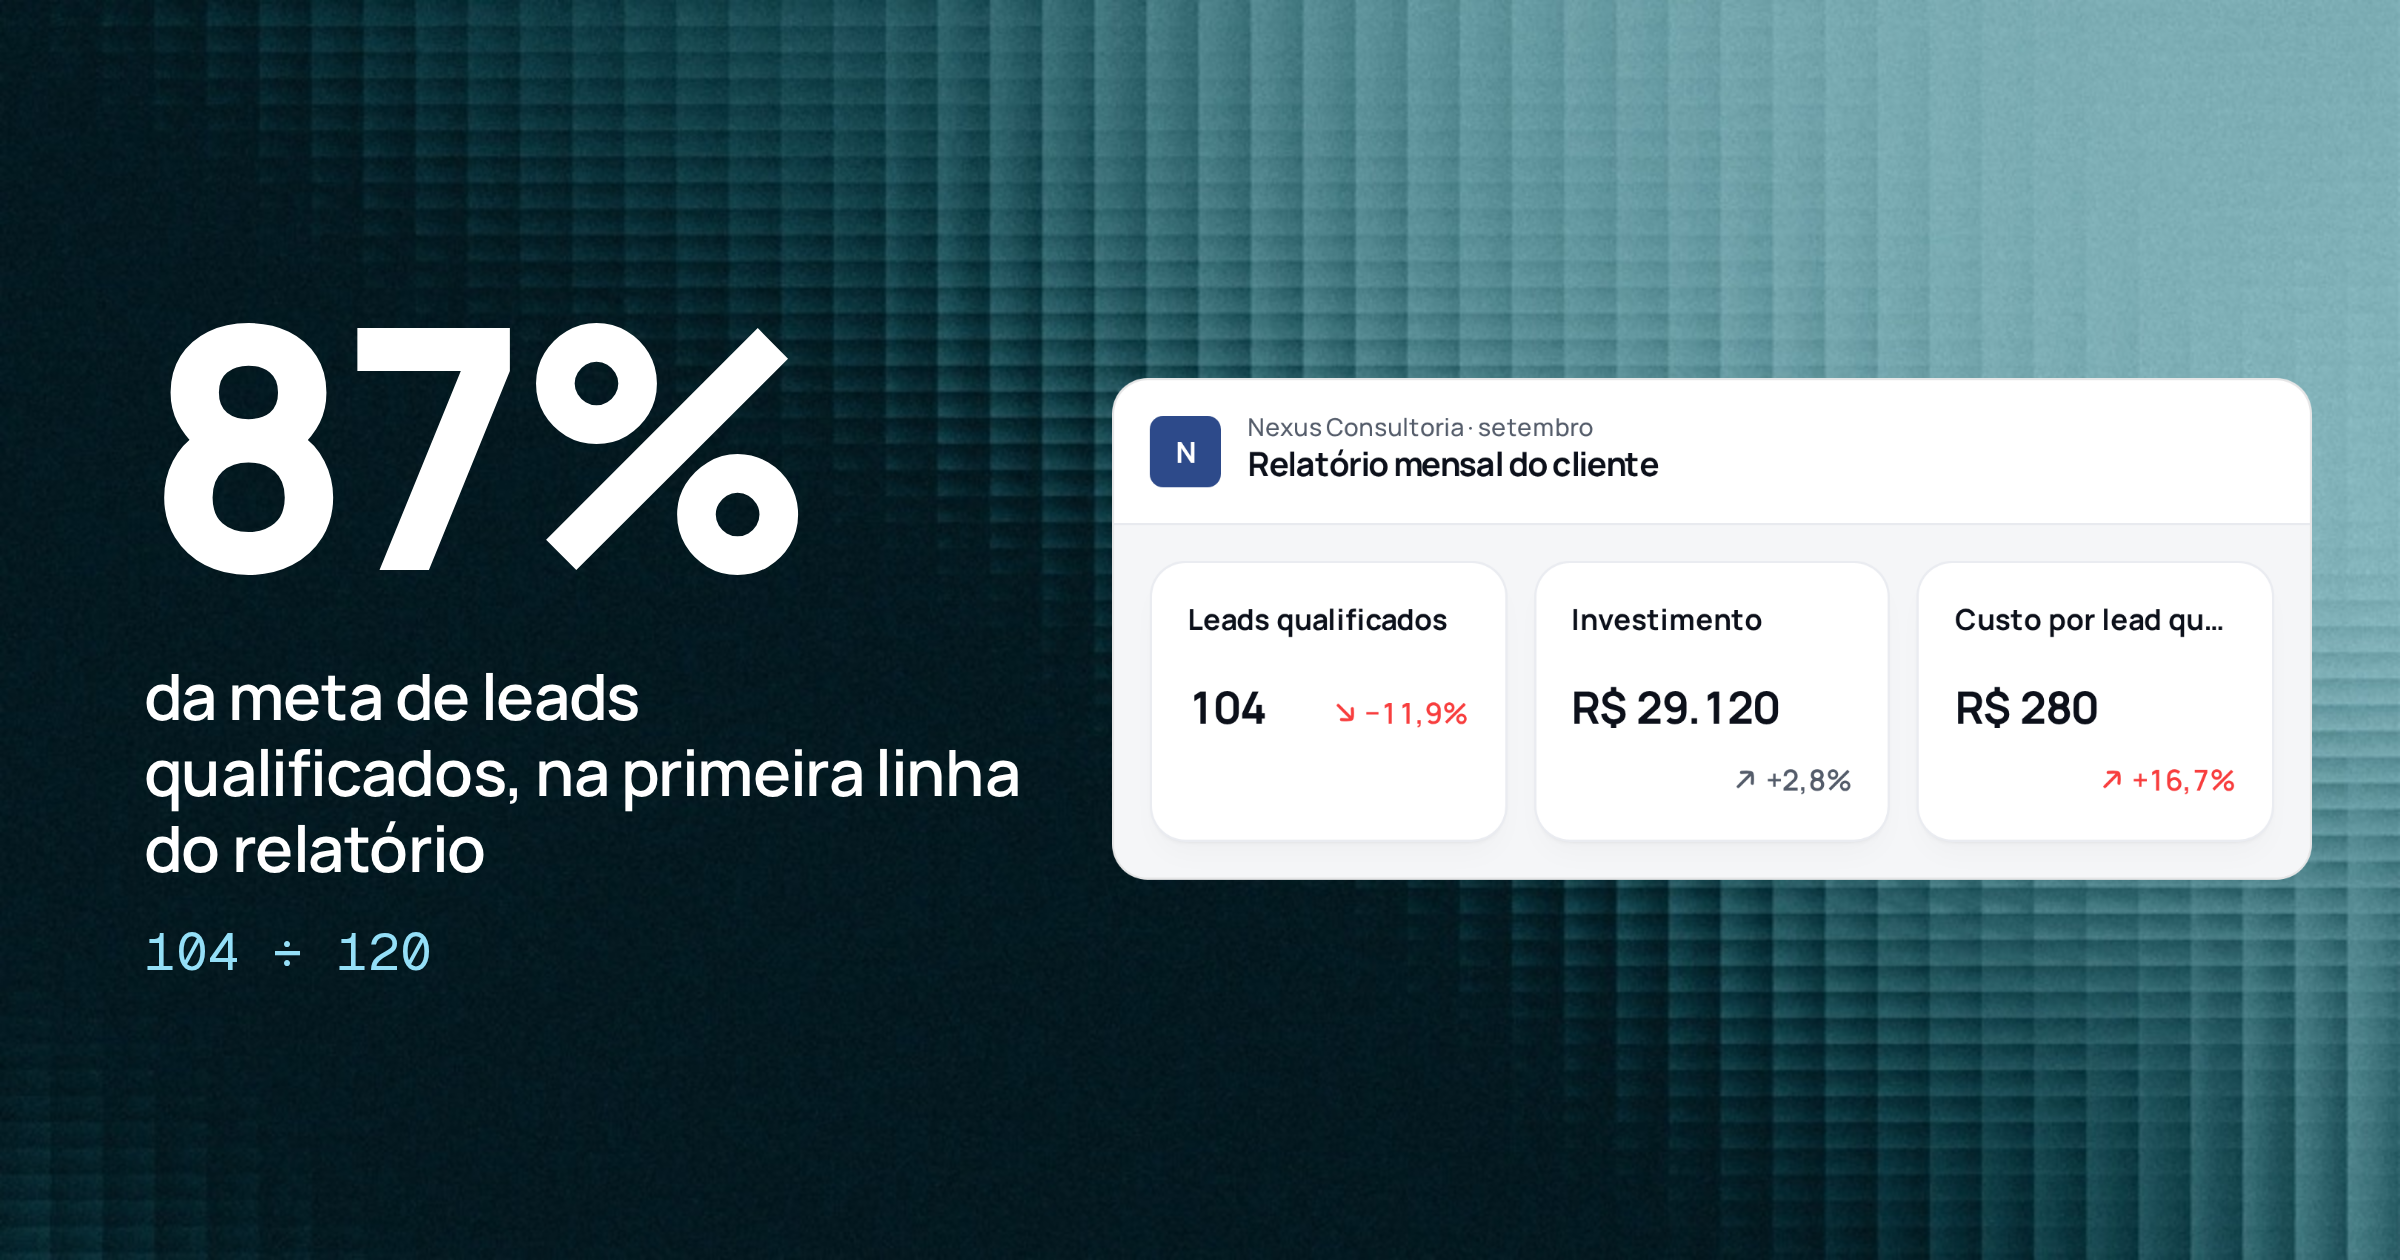
- 1.Did we hit the agreed goal? One sentence, one number, one comparison. "We closed the month with 104 qualified leads against a goal of 120 (87%)."
- 2.Why? What changed compared with the previous month and the likely cause. Two or three reasons, each with evidence.
- 3.What comes next? Next month's actions and what you need from the client to carry them out: budget approval, new creative, CRM access, feedback from the sales team on lead quality.
If the goal was missed, the answer still goes on the first line. Hiding a bad result on page 7 doesn't change the result; it only erodes trust when the client finds it.
One summary page, the rest is appendix
The executive summary fits on one page. If it doesn't, it isn't yet clear what matters. The table below is a template you can copy.
Result of the month
- What goes in
- Main metric against the goal and against the previous month, in one sentence
- Page
- Summary
Business indicators
- What goes in
- Three to five numbers: revenue or qualified leads, spend, cost per acquisition, real ROAS
- Page
- Summary
What changed
- What goes in
- Two or three causes, each tied to a dated annotation
- Page
- Summary
Next steps
- What goes in
- Next month's actions, with owner and deadline
- Page
- Summary
Requests to the client
- What goes in
- What depends on them: approval, materials, access, sales feedback
- Page
- Summary
Detail by channel
- What goes in
- Meta, Google Ads, organic: spend, conversions, cost per conversion
- Page
- Appendix
Campaigns and creatives
- What goes in
- The ones that weighed most on the result, for better and for worse
- Page
- Appendix
Definitions
- What goes in
- How each metric is calculated, source and attribution window
- Page
- Appendix
| Block | What goes in | Page |
|---|---|---|
| Result of the month | Main metric against the goal and against the previous month, in one sentence | Summary |
| Business indicators | Three to five numbers: revenue or qualified leads, spend, cost per acquisition, real ROAS | Summary |
| What changed | Two or three causes, each tied to a dated annotation | Summary |
| Next steps | Next month's actions, with owner and deadline | Summary |
| Requests to the client | What depends on them: approval, materials, access, sales feedback | Summary |
| Detail by channel | Meta, Google Ads, organic: spend, conversions, cost per conversion | Appendix |
| Campaigns and creatives | The ones that weighed most on the result, for better and for worse | Appendix |
| Definitions | How each metric is calculated, source and attribution window | Appendix |
ROAS (return on ad spend) is revenue divided by media spend. "Real ROAS" here means using the revenue recorded in the client's CRM or sales system, not the revenue the ad platform attributes to itself.
A sample summary
Imagine a hypothetical B2B services client with a goal of 120 qualified leads per month at a cost of up to R$250 each, and a planned budget of R$30,000.
Qualified leads
- Goal
- 120
- September
- 104
- August
- 118
- Change
- −11.9%
Spend
- Goal
- R$30,000
- September
- R$29,120
- August
- R$28,320
- Change
- +2.8%
Cost per qualified lead
- Goal
- R$250
- September
- R$280
- August
- R$240
- Change
- +16.7%
| Indicator | Goal | September | August | Change |
|---|---|---|---|---|
| Qualified leads | 120 | 104 | 118 | −11.9% |
| Spend | R$30,000 | R$29,120 | R$28,320 | +2.8% |
| Cost per qualified lead | R$250 | R$280 | R$240 | +16.7% |
The text that goes with the table would be something like: "We reached 87% of the qualified lead goal. The main cause was the quote page form being down for two days, which dragged conversion down mid-month. In October we will check the form daily and test two new ads; we need them approved by the 10th." Four sentences, and the client knows where things stand, why, and what to do.
Business metrics before platform metrics
CTR (click-through rate), CPM (cost per thousand impressions) and frequency explain how the media is working. Revenue, qualified leads and customer acquisition cost (CAC) say whether it is working. The client's decision-maker answers to their own boss with the second group.
That is why the summary starts with what the client measures in their own business, and platform metrics stay in the appendix or show up as the explanation of a cause. A rule of thumb: if the client can't say what to do when that number goes up or down, it doesn't go on the first page.
This requires agreeing at the start of the contract on the main metric and how it is measured. "Qualified lead" needs a written definition (for example, a lead the sales team marked as qualified in the CRM), and that definition goes in the appendix of every report.
Log what changed, with a date
Almost every relevant swing has a cause that someone at the agency or the client knows. If that cause isn't recorded, the report turns into a memory exercise on the 3rd of the following month.
Keep a change log per client, filled in when the change happens, with the date, what changed and who did it. Four types cover most cases:
- Budget: increase, cut, reallocation between channels.
- Creative and offer: new ads, offer change, promotion.
- Tracking: removed tag, broken form, change in conversion settings.
- Context: seasonality, holiday, competitor move, change in the client's sales team.
The platforms help. Google Ads has change history, which lists changes to the account, campaigns and ad groups over the past 2 years, including who made each one. GA4 lets you create annotations in reports with a title, description and date, visible on every line chart in the property, and it also shows system-generated annotations.
Changes in the platforms themselves go in the log too. On January 12, 2026, for example, Meta's Ads Insights API stopped returning the 7-day view and 28-day view attribution windows. Anyone who read conversions through those windows via the API started seeing smaller numbers with no change to the campaign. A report that doesn't annotate this kind of event compares months that aren't comparable.
Weekly pulse, monthly review
Two cadences cover most contracts:
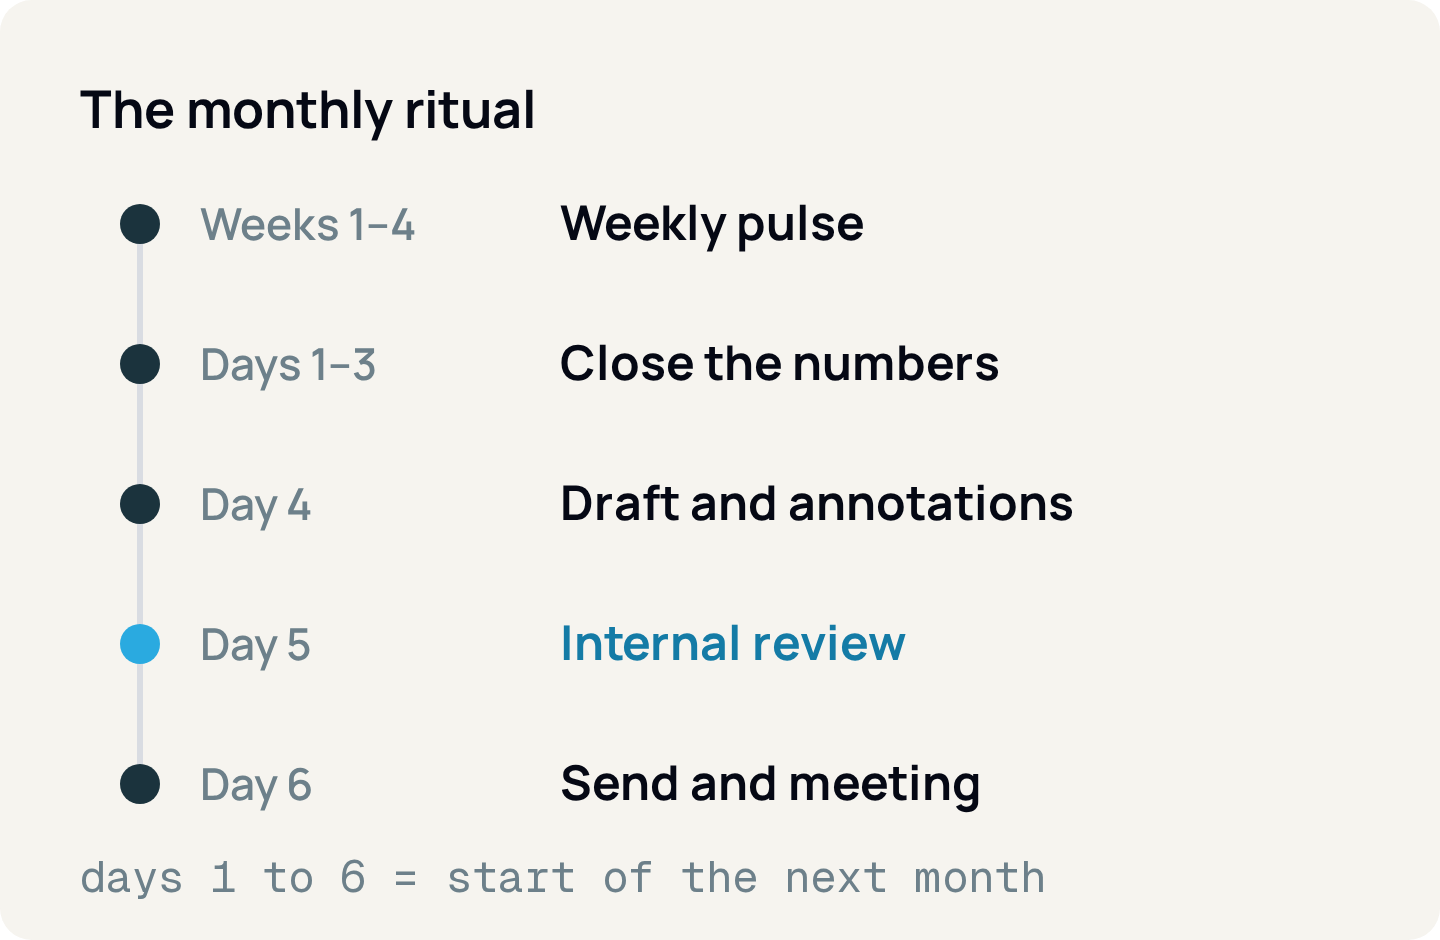
- Weekly pulse: short, almost no text. Goal pacing (where we are against what's expected at this point in the month), alerts and what was done. It keeps the client from being surprised at the end of the month.
- Monthly review: the full report, with the three questions, the appendix and a 30-minute conversation to agree on next steps.
The pulse can be a three-line message with a link to the dashboard. What can't happen is the client finding out on the 5th that the goal slipped away on the 12th of the previous month.
Nobody sends without a review
The report is where a data error becomes a trust error. An internal review before sending catches most of them. Define who reviews (the account manager doesn't review their own report) and a short checklist:
- Does the main number match the agreed source of truth (CRM, sales system)?
- Does the comparison use the same period and the same definitions as last month?
- Does every large swing have a cause, or is it marked as "under investigation"?
- Do the next steps have an owner and a deadline?
- Are the requests to the client written so they can answer yes or no?
The same template for every client
When each manager builds the report their own way, the agency loses two things: the ability to compare clients and the ability to hand an account to someone else without starting over. A single template (same structure, same definitions, same order) lets a lead open ten reports and see within minutes which clients are below goal and why.
Variations by business type (ecommerce measures revenue and ROAS, lead generation measures qualified leads) are decided once and documented.
The mistakes that make clients stop reading
- Screenshot dumps: captures from each platform, with no conclusion. The client doesn't know where to look.
- 40 metrics: everything the platform offers, all with the same weight. What matters gets lost.
- No comparison base: "we spent R$29,000 and generated 104 leads" doesn't say whether that's good. Compare with the goal and the previous month, and with the same month last year when there is seasonality.
- Shifting definitions: a lead that was "form submitted" in August and "qualified lead" in September. If the definition has to change, announce it and recalculate the previous month.
- No next step: the report ends at the chart and the decision is left for "the next meeting".
How Relator helps with this
In Relator, reports start from templates (including Executive summary and Monthly client report), with the agency's and the client's branding. Scheduled sending starts with "I want to review before sending" checked: at the scheduled time, Relator generates the draft and waits for someone to click "Approve and send". Timeline annotations (launch, budget change, promotion) show up on the charts, and the portfolio shows each client's goals and pacing side by side. Availability of each feature depends on the plan.
How to apply
- 1.For each client, write down the main metric, the month's goal and the definition of each indicator. Put it in the appendix.
- 2.Build a single one-page template with the five summary blocks (result, business indicators, what changed, next steps, requests to the client) and move everything else to the appendix.
- 3.Start a change log per client and fill it in on the day the change happens. Use Google Ads change history and GA4 annotations as support.
- 4.Fix the calendar: a pulse every week on the same day, the close a few days after month-end, internal review and sending on fixed dates.
- 5.Name a reviewer for each client who is not the account manager, and use the checklist before every send.
- 6.Every quarter, review the template with two or three clients and announce what will change before changing it.
Sources
About the author
João Vitor Moitinho
João Vitor Moitinho is the founder of Relator Digital. A computer engineer, he works on growth, measurement and martech, and writes here about what he learns building reports for performance agencies.
João Vitor Moitinho on LinkedInThis article is also available as Markdown, for agents and LLMs: view .md version