How to present a bad month without losing the client
Fact, cause, plan and ask: a structure to explain a bad result to a client with numbers, evidence and a next step, without excuses or surprises.

Contents
A bad month does not make you lose a client. What does is the client finding the problem before you do, or hearing an explanation with no number and no plan. Present the bad month in four parts, in this order: the fact, the cause, the plan and the ask. Each part answers a question the client will ask anyway.
Clients forgive the number, not the surprise
Every media manager will have bad months. A pricier auction, a competitor's sale, a site outage, a purchase tag that stopped firing. The client knows this, even if they don't say it. What they don't know is whether you know it too.
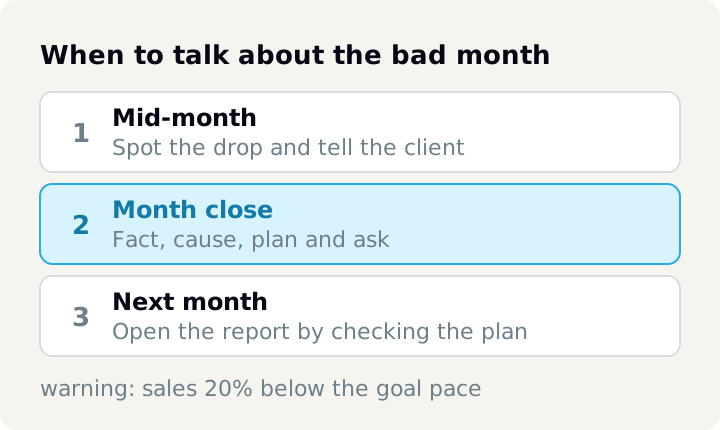
That is why the first rule comes before the report: if the month is going badly, say so when you notice, not at month close. A short message mid-month ("attributed sales are 20% below the pace of the goal; we are already looking into it and will send the full read on Friday") changes the whole conversation. On report day, the client is already expecting the explanation instead of being caught by it.
When the problem shows up first for the client, in the store dashboard or on the bank statement, any explanation afterwards sounds defensive. The same sentence that would have been analysis becomes an excuse.
Fact: state the number before explaining it
Start with the number, with no adjectives and no softening. The temptation is to open with context ("the market is tough", "it was an unusual month"). That makes the client brace for the worst while you talk. Say what happened first and leave the explanation for the second block.
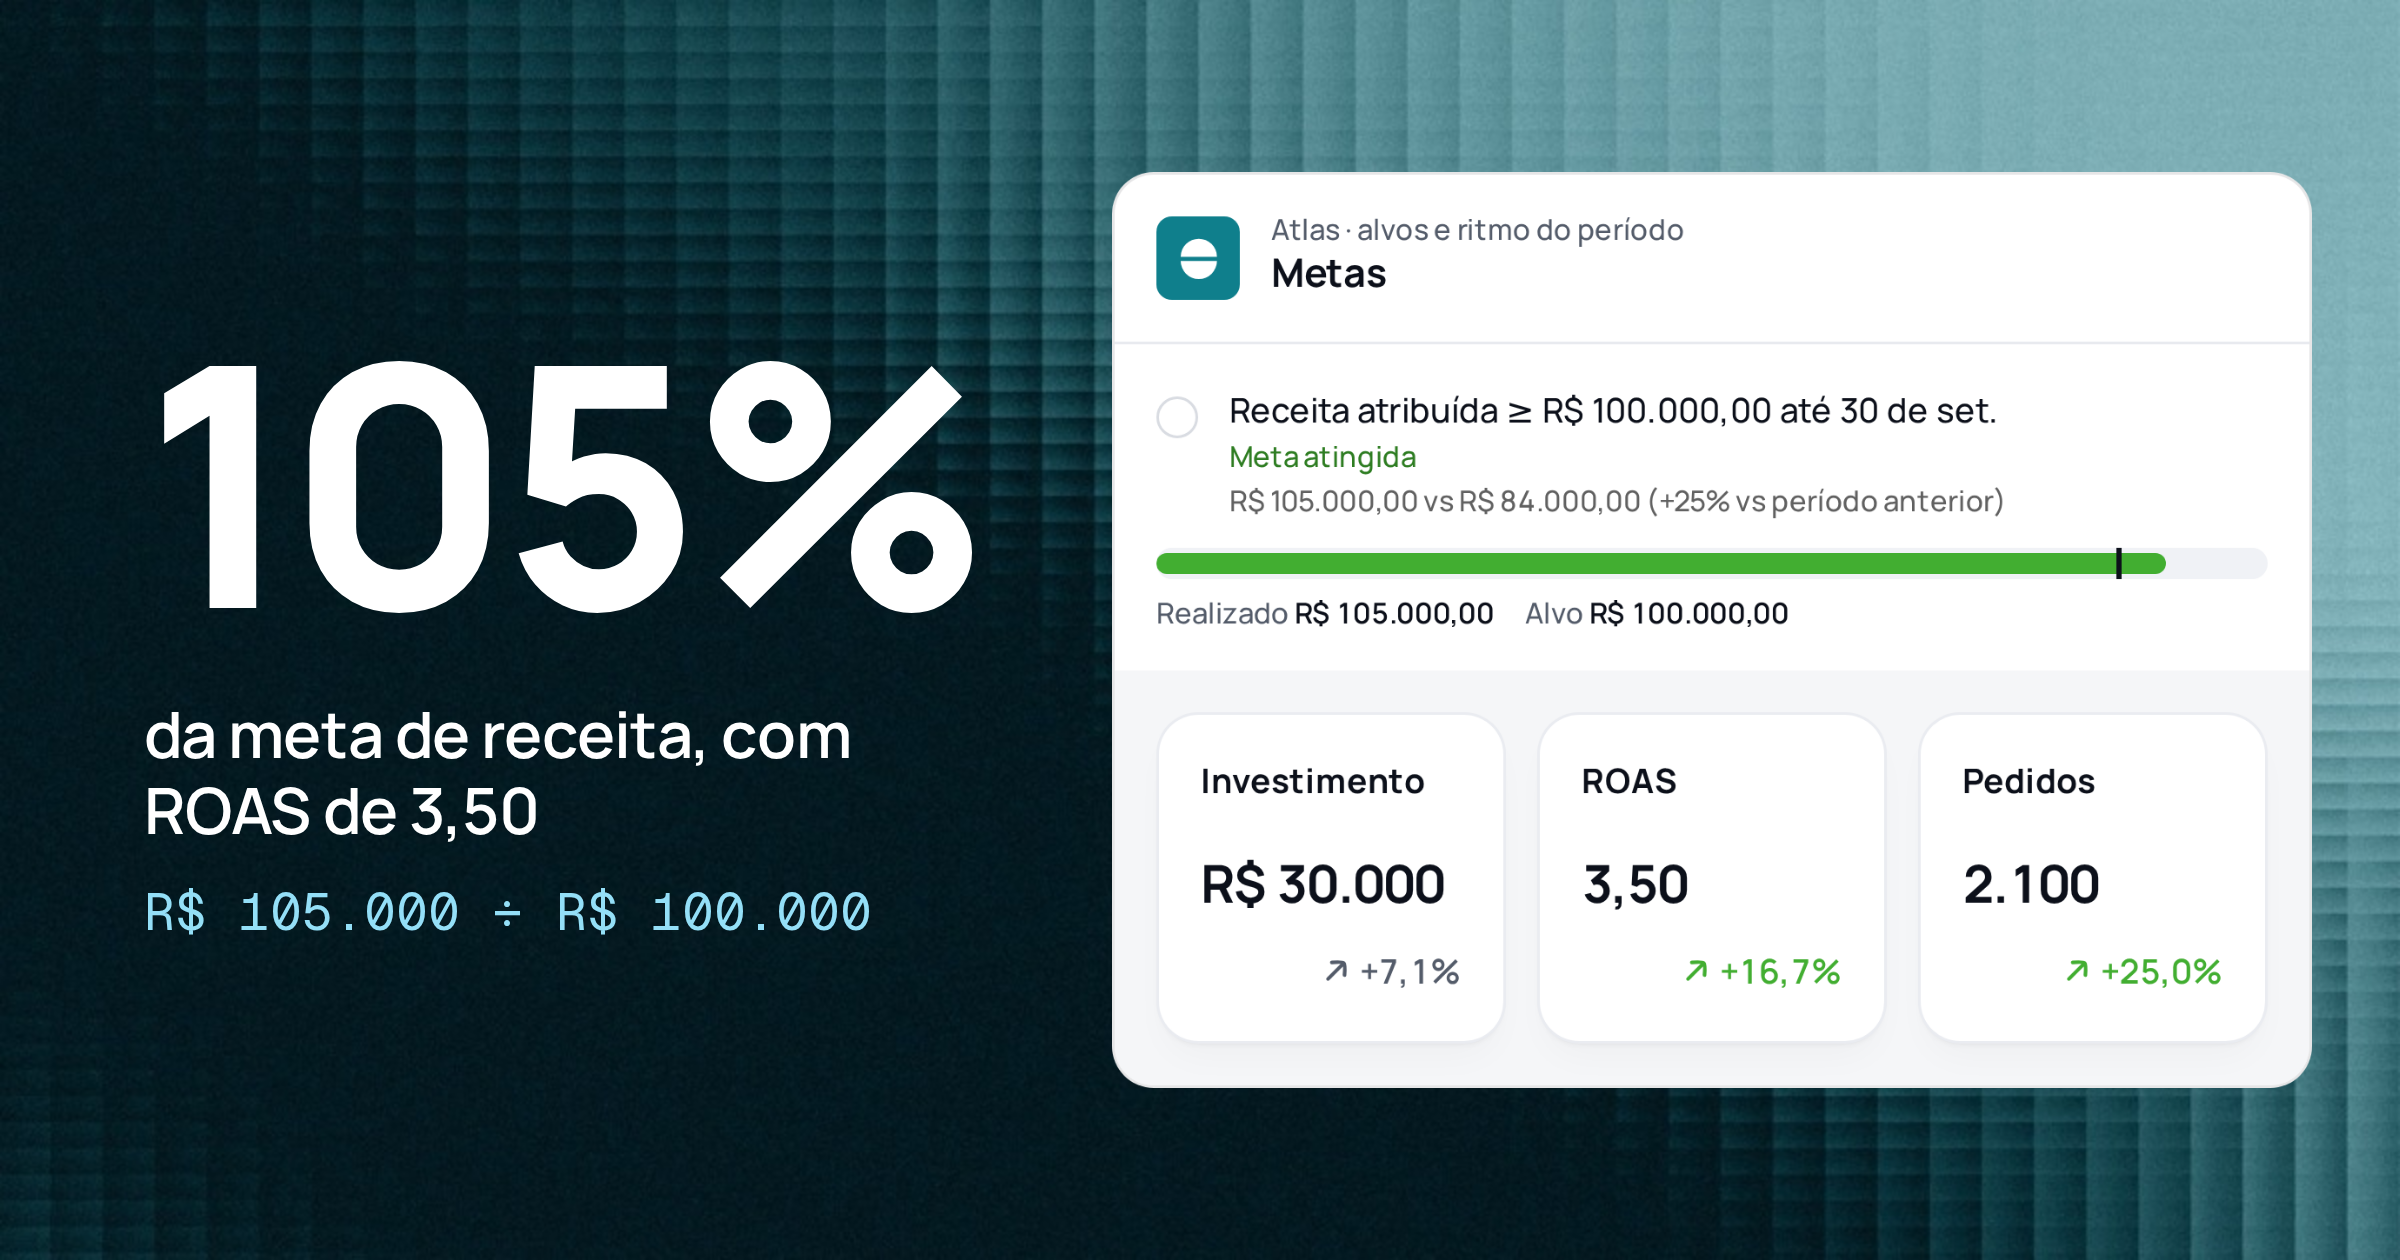
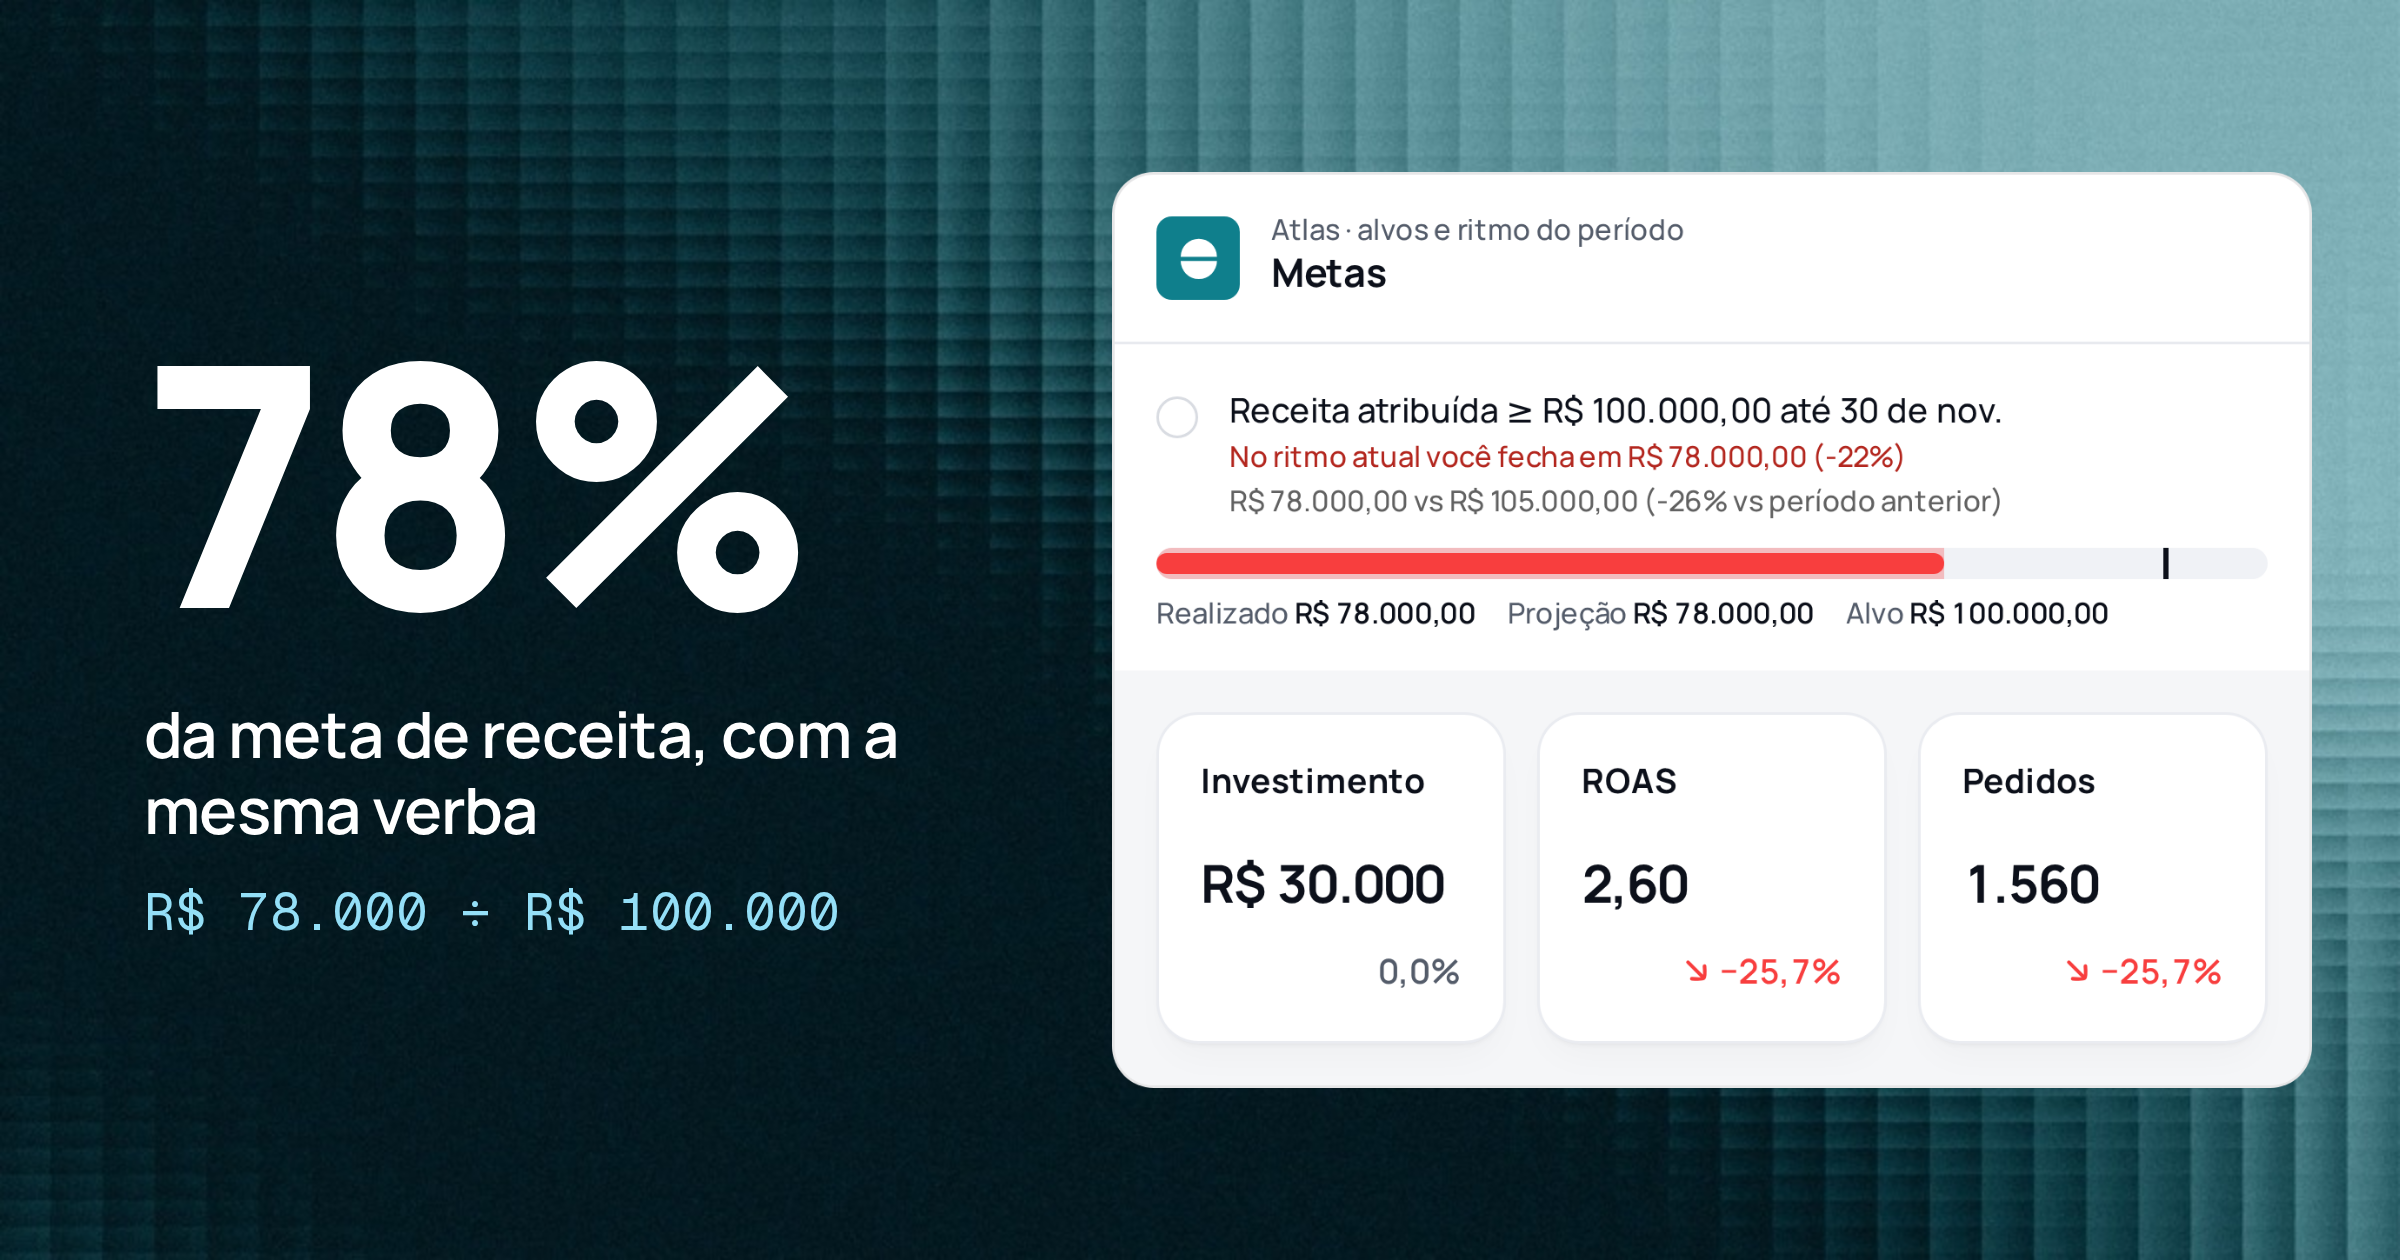
Here is a hypothetical example, with numbers made up only to illustrate. An online store spent the same amount on media in both months:
Media spend
- Previous month
- R$ 30,000
- Month
- R$ 30,000
- Change
- 0.0%
Attributed revenue
- Previous month
- R$ 105,000
- Month
- R$ 78,000
- Change
- −25.7%
ROAS
- Previous month
- 3.50
- Month
- 2.60
- Change
- −25.7%
Orders
- Previous month
- 2,100
- Month
- 1,560
- Change
- −25.7%
Average order value
- Previous month
- R$ 50
- Month
- R$ 50
- Change
- 0.0%
Revenue against the R$ 100,000 goal
- Previous month
- 105%
- Month
- 78%
- Change
- −27 percentage points
| Metric | Previous month | Month | Change |
|---|---|---|---|
| Media spend | R$ 30,000 | R$ 30,000 | 0.0% |
| Attributed revenue | R$ 105,000 | R$ 78,000 | −25.7% |
| ROAS | 3.50 | 2.60 | −25.7% |
| Orders | 2,100 | 1,560 | −25.7% |
| Average order value | R$ 50 | R$ 50 | 0.0% |
| Revenue against the R$ 100,000 goal | 105% | 78% | −27 percentage points |
The math checks out: 105,000 ÷ 30,000 = 3.50 and 78,000 ÷ 30,000 = 2.60. Revenue fell 27,000 ÷ 105,000 ≈ 25.7%, and orders fell 540 ÷ 2,100 ≈ 25.7%. Average order value stayed at R$ 50 in both months (105,000 ÷ 2,100 and 78,000 ÷ 1,560). ROAS (return on ad spend) is revenue divided by spend.
The opening sentence reads: "In November attributed revenue was R$ 78k, 78% of the goal and 26% below October, with the same spend". One sentence, three numbers, no excuses.
The table already says something useful: average order value did not change. The drop came from the number of orders, not the value of each order. That narrows the search for the cause before you even start investigating.
Cause: separate what you know from what you think
The client wants to know why. The worst answer is a list of six possible reasons with no weight, because it shows you don't know. The second worst is a certainty you don't have.
Write the cause in two parts:
- What is proven, with the evidence next to it. For example: "the site's purchase tag was down from the 12th to the 14th, after the store theme was changed; on those three days GA4 recorded zero purchases, while the store platform recorded orders as usual".
- What is still a hypothesis, stated as one and with how you will check it. For example: "hypothesis: cost per click rose because a competitor entered the same keywords; we will check the auction insights report this week".
For the first part, the platforms' own tools help you move past guesswork. Google Ads has explanations, which show factors behind large performance changes, such as bids, budget and conversions. They are available for Search, App, Performance Max, Demand Gen, Display and Video campaigns. For them to show up, the date range cannot include today or go back more than 90 days, and the two periods compared must be the same length and contiguous.
Note that a measurement break changes the question. If part of the drop is a broken tag, the sales happened and simply were not counted. The real result was less bad than the report shows, but you cannot just add an estimated number. Say what was not measured, from when to when, and show the store's data as a separate reference, without mixing it into attributed revenue.
Own what was yours
If the cause was an agency decision (a creative you swapped, a campaign you paused, a bid you changed), say so first and clearly. Clients usually take an owned mistake with a plan well. What they don't accept is finding out later that the reason was yours and was left out.
The reverse also holds: if the cause was on the client's side (stock ran out, the site went down, the sale was not announced), say it without blaming. Fact and date are enough. The goal is to prevent it from happening again, not to win the argument.
Plan: three actions, each with how to measure it
After the cause, the client asks "now what?". The plan answers with at most three actions. More than that becomes a wish list and dilutes responsibility.
Each action needs four things: what will be done, who does it, by when, and which number will show whether it worked. In the example:
- 1.Set up an alert for days with no recorded purchase. Owner: agency. Date: the 5th. Sign it worked: a day with no recorded purchases triggers a warning the same day.
- 2.Tell the agency before any theme or checkout change. Owner: client. Date: from now on. Sign: no change goes live without a test purchase.
- 3.Test two new creatives in the campaigns that lost the most orders. Owner: agency. Date: the 10th. Sign: orders from those campaigns back to last month's pace by the 25th.
The number for each action is what turns the plan into a commitment. In next month's report, you open with this list and say what happened to each item. Whoever does this twice in a row rarely has to defend their work the third time.
Ask: end with a decision
A bad month almost always calls for a decision from the client: keep the budget, cut it, change the goal, approve a test, grant access to some data. If you don't ask, the meeting ends with no decision and next month starts in the same place.
Write the ask so the answer is yes or no: "Can we keep spend at R$ 30,000 in December and review on the 15th, once the alert and the new creatives are running?". An open question ("what do you think?") hands the problem back to the client.
If the bad month needs no decision, say that too: "we don't need to change the budget; the plan above is agency execution only". That shows you have the situation under control.
What not to do
Some common habits make the conversation worse, even with good intentions:
- Switching the metric. If the agreed metric was revenue and revenue fell, don't open with the reach that went up. The client notices the switch and starts distrusting the other metrics.
- Hiding the goal. Removing the goal column in a bad month removes its value in the good months.
- Blaming the algorithm. "Meta changed the algorithm" is not a cause, it is the absence of one. If you don't know, say you are still investigating and when you will come back with the answer.
- Promising to recover everything next month. Promise the actions and the signals, not a number that depends on the market.
- Sending the PDF without a conversation. A bad month deserves at least a message or a short call along with the report.
Record the month for the next report
Six months from now, nobody will remember why November dropped. The chart will show the dip, and the question will come back. So record the cause where the number lives.
In GA4, annotations mark a date or a date range on line charts, with a title of up to 60 characters and a description of up to 150. They show up in every report with a line chart in the property, and users with the Analyst role or above can create, edit and delete them. An annotation such as "Purchase tag down, Nov 12–14" keeps the same drop from being explained again, or explained badly, next year.
In Relator Digital, the client timeline keeps annotations such as launches, budget changes and sales, which appear on the charts, and automatically logs alerts, sent reports and connected sources. An invited client sees this timeline in the portal, so the explanation for the bad month sits in the same place as the number.
How to apply it
- 1.Agree with each client on the goal and the expected monthly pace, so you know early when something goes off track.
- 2.Mid-month, if the pace is below expectations, send a short message with the number and the date you will come back with the full read.
- 3.Open the report with a fact sentence: the number, the goal and the previous month.
- 4.Write the cause in two lists: proven, with evidence, and hypothesis, with how to check it.
- 5.Limit the plan to three actions with an owner, a date and the number that shows whether it worked.
- 6.End with an ask that can be answered yes or no.
- 7.Annotate the cause on the charts (GA4 or your reporting tool) and open the next report by checking the plan.
Sources
- Google Ads: About explanations — what explanations show, supported campaign types and date range rules (accessed October 27, 2026).
- Google Analytics: Create and manage annotations — character limits, visibility in reports and required roles (accessed October 27, 2026).
About the author
João Vitor Moitinho
João Vitor Moitinho is the founder of Relator Digital. A computer engineer, he works on growth, measurement and martech, and writes here about what he learns building reports for performance agencies.
João Vitor Moitinho on LinkedInThis article is also available as Markdown, for agents and LLMs: view .md version