Incrementality on a small budget: holdout tests for SMBs
Incrementality is the sale that only happened because of the ad. Measure it with a simple geo holdout, with the math shown, without a big-brand budget.

Contents
Incrementality is the share of sales that only happened because the ad ran. You can measure it without a big-brand budget: turn the ad off in one group that looks like the group still being advertised to, and compare the results. For a small account, the simplest version is a geo holdout, where one region goes without ads during the test.
Attribution counts who clicked; incrementality counts who wouldn't have bought without the ad
Attribution splits credit between touchpoints. It doesn't know what would have happened without the ad. Someone who was going to buy anyway but clicked your remarketing ad first shows up as a conversion in the report and as a sale you would have had regardless.
That is why the two questions differ:
- Attribution: which ads were these sales credited to?
- Incrementality: how many of these sales would disappear if I turned the ad off?
The second can only be answered with a comparison group, meaning people (or places) that did not see the ad. The idea is the same as any experiment: a test group gets the ad, a control group, also called a holdout, does not, and the difference between them is the effect.
Platforms measure lift, but not always at the size of your account
Before building something manual, it's worth knowing what already exists. Checked today in the official documentation.
Google Ads
- What the documentation says
- Geography-based Conversion Lift splits the audience by region and also suits measuring offline conversions and other channels. It is available for several campaign types, but access requires talking to a Google representative. The page says the budget requirement tends to be higher than for users-based studies, and that results are noisier and not sliced by demographics.
Meta
- What the documentation says
- A lift study creates a randomized test group of Accounts Center accounts and a control group that does not see ads;
treatment_percentageandcontrol_percentageadd up to 100. Access is limited and the documentation says to contact your Meta representative. Once the study starts, you can't changetreatment_percentageor the objectives.
| Platform | What the documentation says |
|---|---|
| Google Ads | Geography-based Conversion Lift splits the audience by region and also suits measuring offline conversions and other channels. It is available for several campaign types, but access requires talking to a Google representative. The page says the budget requirement tends to be higher than for users-based studies, and that results are noisier and not sliced by demographics. |
| Meta | A lift study creates a randomized test group of Accounts Center accounts and a control group that does not see ads; treatment_percentage and control_percentage add up to 100. Access is limited and the documentation says to contact your Meta representative. Once the study starts, you can't change treatment_percentage or the objectives. |
Two practical consequences. First, for accounts that invest little, these tests may simply be unavailable. Second, even when available, they measure one platform at a time; Google's documentation specifically highlights that the geography format allows looking across channels.
If you don't have access, the design below answers the same question with more manual work and less precision.
A manual geo holdout fits a small account
The minimum design has four pieces. It is a general statistical method, not a platform tool, so the precautions below are our judgment, not an official rule.
- 1.Two comparable regions. Pick areas (states, metro areas) with sales volume of the same order of magnitude and similar behavior. Call A the one that keeps the ads and B the one that goes without.
- 2.A prior period. Before turning anything off, look week by week at how much B sells relative to A. If the B/A ratio is stable, A works as a ruler for B. If it swings a lot, the comparison won't give you anything reliable.
- 3.A test period that covers the buying cycle. If customers take two weeks between first click and purchase, a one-week test measures almost nothing. Use at least the full cycle and whole weeks, so weekends and weekdays don't get mixed.
- 4.A real control region. In B, exclude the region from the targeting of every paid campaign you control, not just one.

Reading the result takes three steps: compute the B/A ratio from the prior period, apply that ratio to A's sales in the test to estimate how much B would sell with ads, and compare it with what B actually sold.
An example with the math shown
The numbers below are hypothetical. An online store advertises in two regions. In the 4 weeks before the test, A made 200 orders and B made 180, so B/A = 180 ÷ 200 = 0.9. Then, for 4 weeks, ads stayed on only in A, with R$ 12,000 invested. The platform attributed 120 conversions to that spend.
B/A ratio before
- Value
- 0.9
- Calculation
- 180 ÷ 200
Orders in A during the test
- Value
- 260
- Calculation
- observed
Expected orders in B with ads
- Value
- 234
- Calculation
- 0.9 × 260
Orders in B during the test (no ads)
- Value
- 198
- Calculation
- observed
Orders lost in B
- Value
- 36
- Calculation
- 234 − 198
Incremental orders in A
- Value
- 40
- Calculation
- 36 ÷ 0.9
Incremental share of A's sales
- Value
- 15.4%
- Calculation
- 40 ÷ 260
CPA per the report
- Value
- R$ 100
- Calculation
- 12,000 ÷ 120
Incremental CPA
- Value
- R$ 300
- Calculation
- 12,000 ÷ 40
| Item | Value | Calculation |
|---|---|---|
| B/A ratio before | 0.9 | 180 ÷ 200 |
| Orders in A during the test | 260 | observed |
| Expected orders in B with ads | 234 | 0.9 × 260 |
| Orders in B during the test (no ads) | 198 | observed |
| Orders lost in B | 36 | 234 − 198 |
| Incremental orders in A | 40 | 36 ÷ 0.9 |
| Incremental share of A's sales | 15.4% | 40 ÷ 260 |
| CPA per the report | R$ 100 | 12,000 ÷ 120 |
| Incremental CPA | R$ 300 | 12,000 ÷ 40 |
The report says each sale cost R$ 100. The test says the ad generated 40 sales that would not exist without it, one in every three of the 120 attributed, and that each extra sale cost R$ 300.
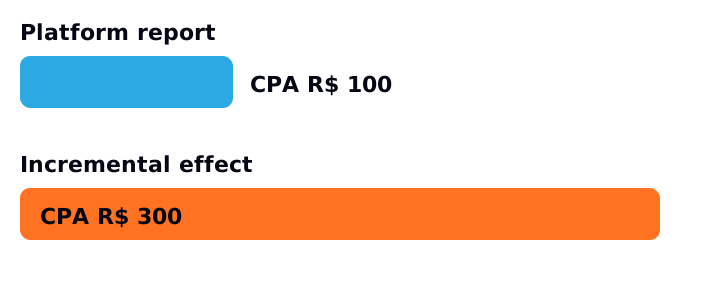
That doesn't mean the ad isn't worth it. It depends on margin: if the profit on each order covers R$ 300, it still pays for itself. What changes is the decision, which is now based on the cost of the sale that only existed because of the ad.
Where the test misleads you
A manual holdout has limits you need to keep in mind before acting on the result.
- Normal swing. If the B/A ratio varies, say, between 0.85 and 0.95 from week to week before the test, a difference of a few points in the test proves nothing. Compare the effect with that historical swing; only trust it when it is clearly larger.
- Few conversions. With few orders per region, a single large sale changes the result. The design works best when each region has reasonable weekly volume.
- Leakage between regions. People travel, and national media (TV, influencers, email) reaches both regions. The effect of the tested channel gets diluted.
- Events mid-test. A promotion, holiday or site outage in only one region invalidates the comparison. Write down everything that happens.
- Long-term effect. Four weeks without ads says little about what happens over six months, such as the effect on brand and repeat purchase.
How to apply
- 1.Choose a single question, for example: "does remarketing pay for itself?".
- 2.List candidates for A and B and compute the B/A ratio week by week over the last 8 to 12 weeks; keep the pair with the most stable ratio.
- 3.Set the duration before you start, covering at least one full buying cycle, and don't end the test early just because the result looks good.
- 4.Exclude B from all relevant paid campaigns and record the date.
- 5.At the end, redo the example's table with your numbers and compare the effect with the ratio's historical swing.
- 6.Decide with margin in hand: does the incremental CPA fit within the profit per order?
- 7.If the result is ambiguous, tell the client so and repeat with a longer period or another pair of regions, instead of forcing a conclusion.
Sources
- Google Ads Help: Comparing lift types
- Meta for Developers, Marketing API: Lift studies
This article is also available as Markdown, for agents and LLMs: view .md version