Averaging rates lies: why every metric needs exactly one definition
CTR, CPA and ROAS come from summing the numerator and denominator, never from averaging rates. See the mistake, the right math and how to lock each definition.

Contents
Averaging rates almost always gives you the wrong number. CTR, CPC, CPA, ROAS and conversion rate are divisions, and a division only makes sense when you sum the numerator and the denominator for the whole period and divide once. When the same metric is computed differently in every spreadsheet, the problem stops being about math and becomes about trust: nobody knows which number counts.
Averaging rates gives equal weight to things that don't weigh the same
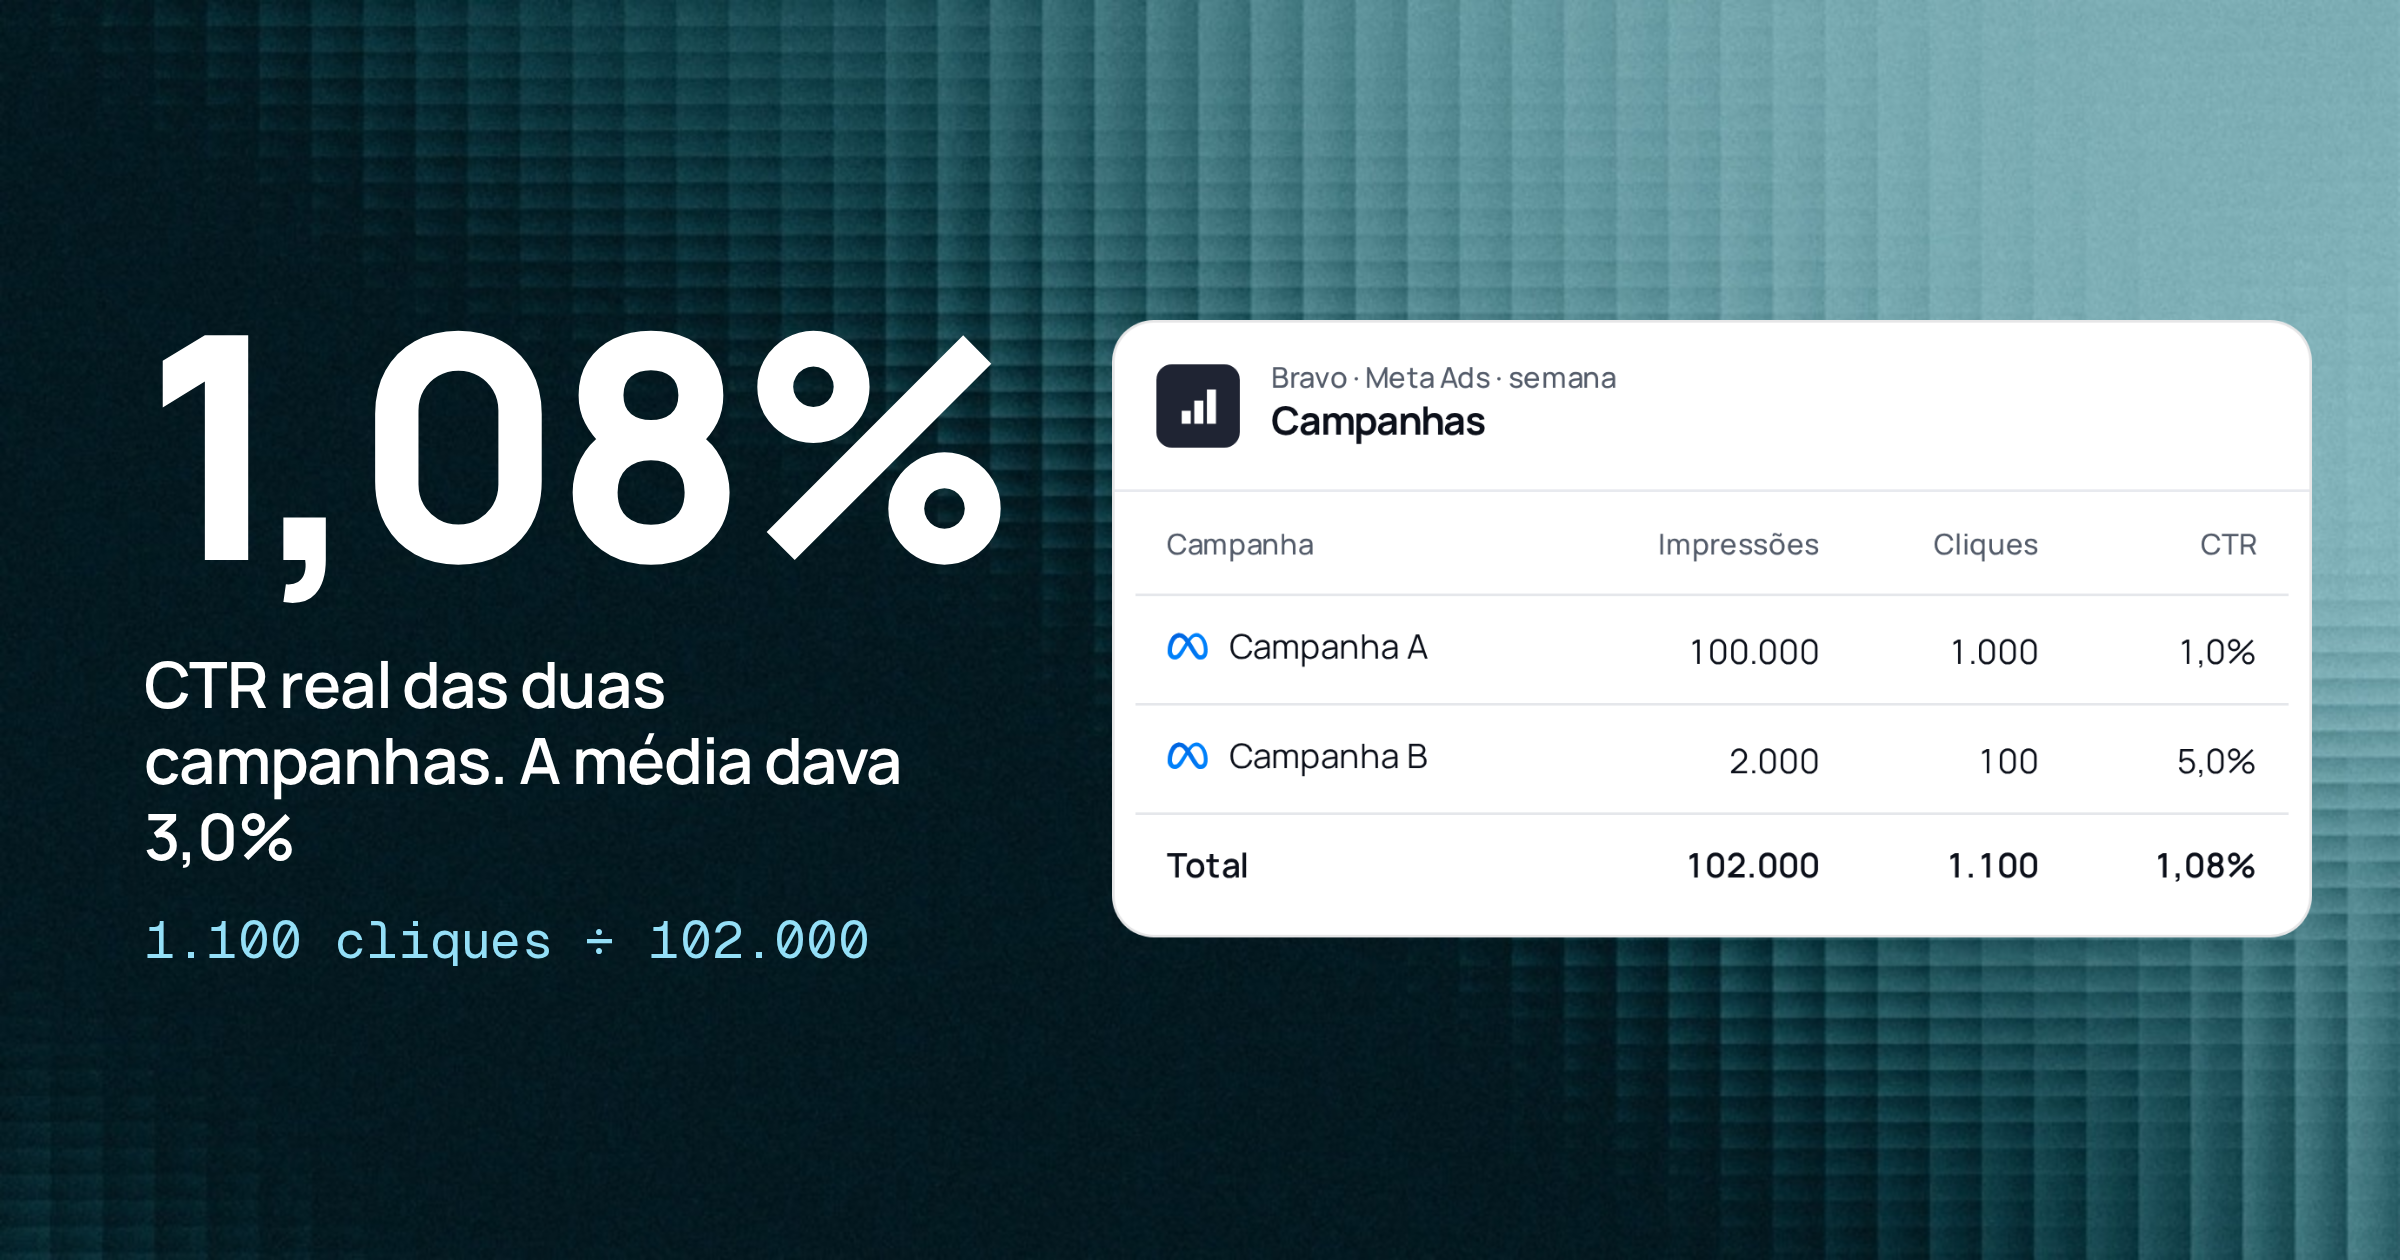
Picture two hypothetical campaigns in the same week. Campaign A had 100,000 impressions and 1,000 clicks. Campaign B had 2,000 impressions and 100 clicks.
A
- Impressions
- 100,000
- Clicks
- 1,000
- CTR
- 1.0%
B
- Impressions
- 2,000
- Clicks
- 100
- CTR
- 5.0%
Average of CTRs
- Impressions
- Clicks
- CTR
- 3.0%
Real CTR (sum ÷ sum)
- Impressions
- 102,000
- Clicks
- 1,100
- CTR
- 1.08%
| Campaign | Impressions | Clicks | CTR |
|---|---|---|---|
| A | 100,000 | 1,000 | 1.0% |
| B | 2,000 | 100 | 5.0% |
| Average of CTRs | 3.0% | ||
| Real CTR (sum ÷ sum) | 102,000 | 1,100 | 1.08% |
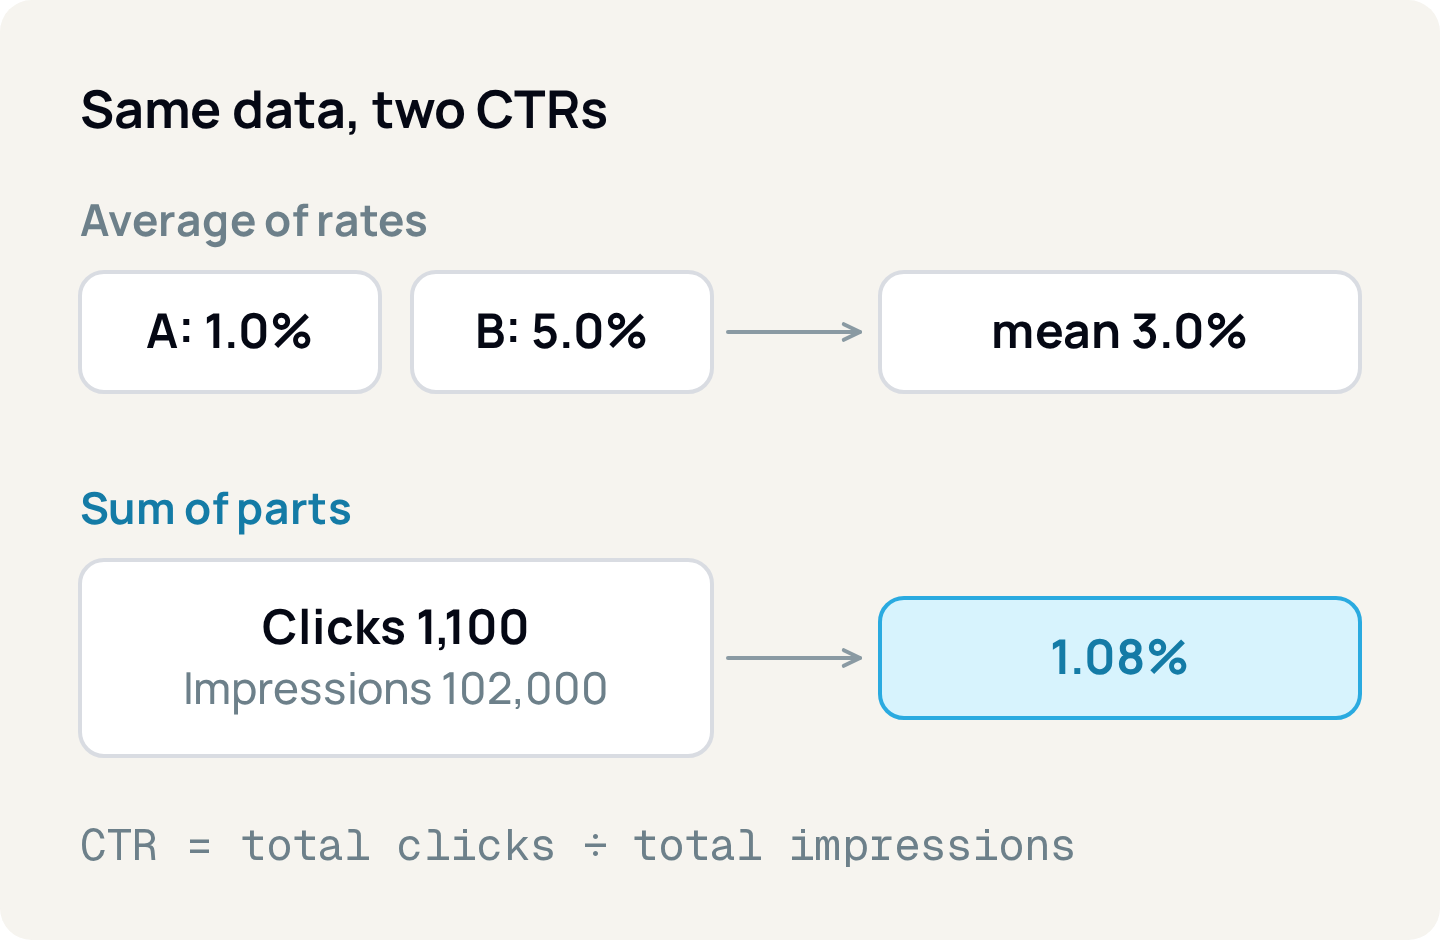
The average of the two CTRs is 3.0%. But the CTR (clickthrough rate, clicks ÷ impressions) of both campaigns together is 1,100 ÷ 102,000 = 1.08%. The average treated B, which had 2% of the impressions, as if it counted as much as A. If you take 3.0% to the client, you are nearly tripling the real rate.
The rule holds for any metric that is a division. Google Ads defines CTR as clicks divided by impressions, and conversion rate as conversions divided by the interactions that can be tracked to a conversion. Neither definition mentions an average. To combine campaigns, days, accounts or channels, sum the parts and divide at the end.
Average daily ROAS is not the period's ROAS
The same mistake shows up over time. A hypothetical account spent $2,000 over three days:
1
- Spend
- $1,000
- Attributed revenue
- $2,000
- Daily ROAS
- 2.0
2
- Spend
- $100
- Attributed revenue
- $800
- Daily ROAS
- 8.0
3
- Spend
- $900
- Attributed revenue
- $900
- Daily ROAS
- 1.0
Average of daily ROAS
- Spend
- Attributed revenue
- Daily ROAS
- 3.67
Period ROAS
- Spend
- $2,000
- Attributed revenue
- $3,700
- Daily ROAS
- 1.85
| Day | Spend | Attributed revenue | Daily ROAS |
|---|---|---|---|
| 1 | $1,000 | $2,000 | 2.0 |
| 2 | $100 | $800 | 8.0 |
| 3 | $900 | $900 | 1.0 |
| Average of daily ROAS | 3.67 | ||
| Period ROAS | $2,000 | $3,700 | 1.85 |
The period's ROAS (return on ad spend, revenue ÷ spend) is $3,700 ÷ $2,000 = 1.85. The average of the three daily ROAS figures is (2.0 + 8.0 + 1.0) ÷ 3 = 3.67, almost double. Day 2 spent only $100 but weighed as much as day 1, which spent ten times more. Low-spend days tend to have extreme rates, high or low, and the average gives them a voice the money didn't.
CPA (cost per acquisition) has the same trap: total spend ÷ total conversions, never the average of per-campaign CPAs.
The mix changes the conclusion, not just the number
Summing the parts fixes the math, but reading the result still takes care. Look at two hypothetical campaigns, with clicks and conversions split by device:
X
- Mobile
- 20 of 1,000 (2.0%)
- Desktop
- 50 of 500 (10.0%)
- Total
- 70 of 1,500 (4.67%)
Y
- Mobile
- 3 of 200 (1.5%)
- Desktop
- 160 of 2,000 (8.0%)
- Total
- 163 of 2,200 (7.41%)
| Campaign | Mobile | Desktop | Total |
|---|---|---|---|
| X | 20 of 1,000 (2.0%) | 50 of 500 (10.0%) | 70 of 1,500 (4.67%) |
| Y | 3 of 200 (1.5%) | 160 of 2,000 (8.0%) | 163 of 2,200 (7.41%) |
X converts better on mobile (2.0% vs 1.5%) and on desktop (10.0% vs 8.0%). Even so, Y converts better overall (7.41% vs 4.67%). This is not a math error: Y concentrated its clicks on desktop, where everyone converts more. The effect has a name, Simpson's paradox, and it explains why comparing overall rates between campaigns with very different audiences, devices or placements can mislead.
The way out is not to pick a side. Look at the total (which shows the real result) and at the breakdown (which shows why), and don't move budget based on a rate without knowing the mix behind it.
Some metrics add up, others must be recounted
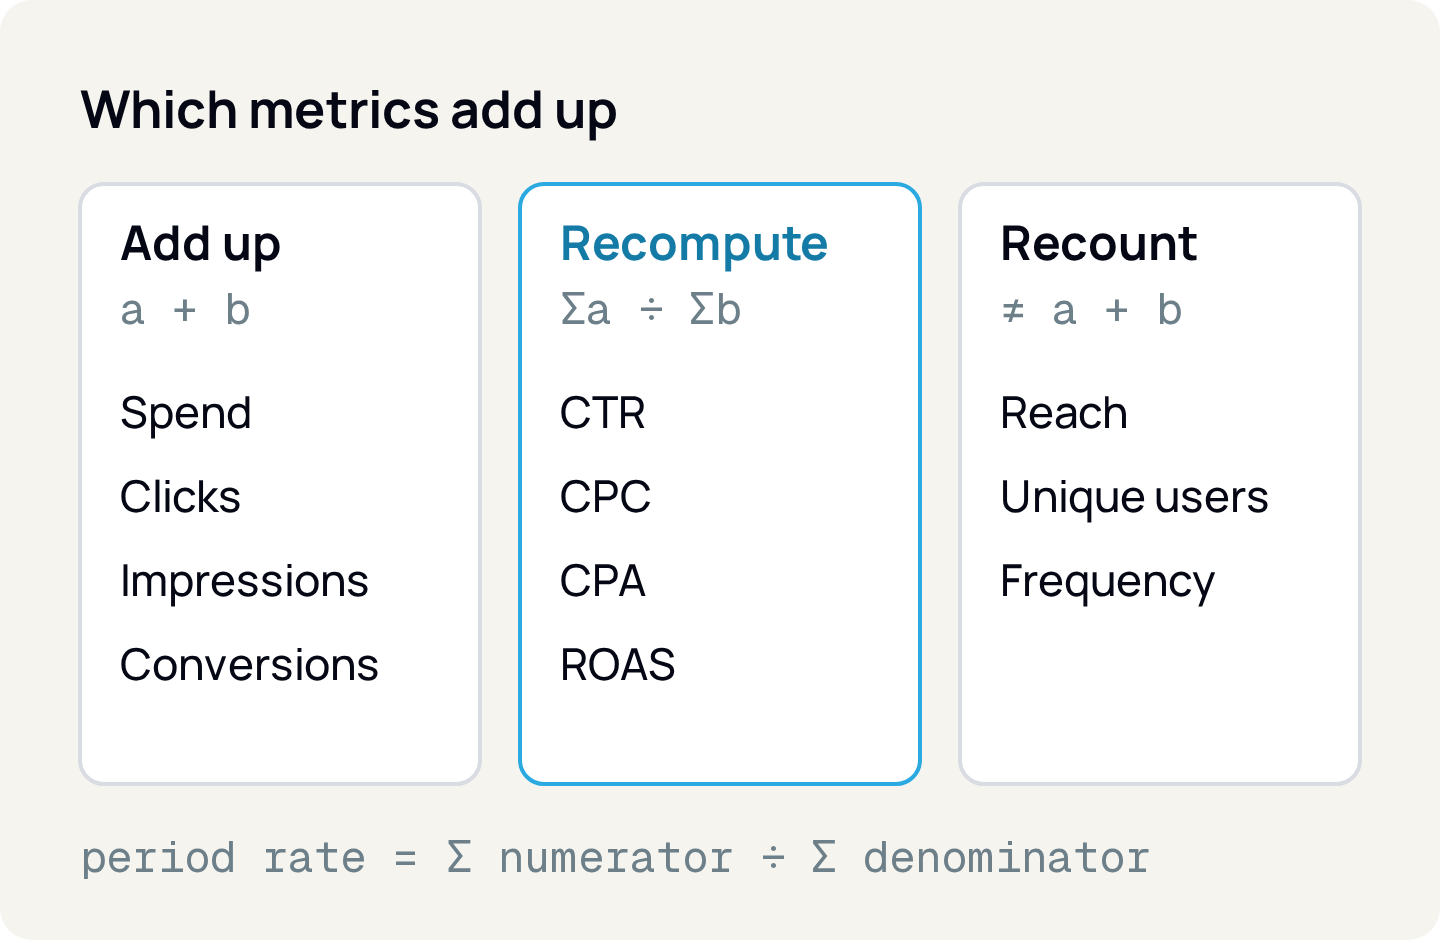
Before combining rows, ask whether the metric is additive, that is, whether the sum of the parts equals the total.
- Add up: spend, impressions, clicks, conversions, conversion value. Summing the days gives the week; summing the campaigns gives the account.
- Recompute: CTR, CPC, CPA, ROAS, conversion rate. They don't add up and can't be averaged, but they come out right from the parts that do add up.
- Recount: reach, unique users and everything that depends on them, such as frequency. The same person shows up on several days and in several campaigns.
Meta's reach is an estimate of the Accounts Center accounts that saw the ad at least once. If a hypothetical campaign reached 10,000 accounts a day for seven days, the sum is 70,000, but the week's reach can be anything between 10,000 (the same people every day) and 70,000 (new people every day). Only the platform, with the data for each exposure, knows the real number. The same goes for users in GA4: a month's total users is not the sum of each day's users.
Frequency inherits the problem. With 140,000 impressions in the week, dividing by the sum of daily reach gives 140,000 ÷ 70,000 = 2.0. If the week's real reach was 25,000, the real frequency is 140,000 ÷ 25,000 = 5.6. Computing it from the sum underestimates saturation exactly when it matters.
For metrics that don't add up, ask the source for the number already computed for the whole period (one weekly report, not seven daily ones), or recompute it from raw data with a distinct count. And say in the report when a number is approximate.
"Conversion" means different things in each tool
Even with the right math, two screens can disagree because they are not counting the same thing.
- In Google Ads, the "Conversions" column shows only primary conversion actions, the ones used for bidding. Secondary actions appear only in "All conversions", which also includes cross-device conversions and other sources.
- In GA4, what used to be called a conversion is now called a key event. "Conversion" is now reserved for the event you bring into Google Ads to measure and optimize campaigns.
- Google Ads conversion rate divides by interactions. Your spreadsheet may divide by clicks, by GA4 sessions or by CRM leads.
None of these choices is wrong. The mistake is putting numbers with different definitions side by side under the same name. If the report says "conversions", it needs to say which ones.
Write each definition once: the metrics registry
A definitions registry is a simple table that answers five questions for each metric. A hypothetical example:
CTR
- Formula
- sum(clicks) ÷ sum(impressions)
- Source
- Meta Ads, Google Ads
- Grain
- ad per day
- Owner
- paid media
ROAS
- Formula
- sum(conversion value) ÷ sum(spend)
- Source
- ad platforms
- Grain
- campaign per day
- Owner
- paid media
Conversion
- Formula
- purchase event (GA4 key event, Google Ads primary action)
- Source
- GA4, Google Ads
- Grain
- event
- Owner
- analytics
Conversion rate
- Formula
- sum(conversions) ÷ sum(clicks)
- Source
- ad platforms
- Grain
- campaign per day
- Owner
- paid media
Reach
- Formula
- unique count of accounts in the requested period
- Source
- Meta Ads
- Grain
- whole period
- Owner
- paid media
| Metric | Formula | Source | Grain | Owner |
|---|---|---|---|---|
| CTR | sum(clicks) ÷ sum(impressions) | Meta Ads, Google Ads | ad per day | paid media |
| ROAS | sum(conversion value) ÷ sum(spend) | ad platforms | campaign per day | paid media |
| Conversion | purchase event (GA4 key event, Google Ads primary action) | GA4, Google Ads | event | analytics |
| Conversion rate | sum(conversions) ÷ sum(clicks) | ad platforms | campaign per day | paid media |
| Reach | unique count of accounts in the requested period | Meta Ads | whole period | paid media |
The grain is the level of detail of the stored row (ad per day, campaign per week). It tells you what can be safely summed and what has to be recomputed. The owner is whoever decides when the definition changes, and tells everyone when it does.
The registry alone already prevents a lot of arguments. The next step is to take the math out of each person's hands.
Semantic layer: the definition becomes code
A semantic layer is a model that sits between the database and whoever consumes the numbers (dashboard, spreadsheet, report, AI assistant). In it you declare the measures that add up and the derived metrics, such as "CTR is the sum of clicks divided by the sum of impressions". Whoever asks requests "CTR by campaign for the month" and the layer generates the right math for that slice, instead of each tool inventing its own.
There are several implementations: Cube declares measures and treats measures such as distinct counts and averages as non-additive; the dbt Semantic Layer has ratio metrics, with the numerator and denominator aggregated before the division; Looker's LookML defines sum, average and distinct count measures in the model. The tool matters less than the principle: the formula lives in one place, versioned, and every consumer reads from there.
At Relator Digital, metrics go through a semantic layer built on Cube. CTR is declared as clicks ÷ impressions and ROAS as conversion value ÷ spend, computed over the sums of the requested slice, and division by zero returns empty instead of 0 (a campaign with no clicks doesn't show up with the cheapest CPC). Meta frequency computed from daily reach is flagged as approximate, with a separate measure for deduplicated frequency over 7- and 28-day windows. Dashboard, report and RelatorAI query these same definitions.
How to apply
- 1.Look for averages of rates in your reports and spreadsheets:
AVERAGE()over CTR, CPC, CPA, ROAS or conversion rate columns. Replace them with sum of the numerator ÷ sum of the denominator. - 2.Classify every metric you report as "add up", "recompute" or "recount". For the last group, pull the whole-period number from the source and don't sum days.
- 3.Build the definitions registry with name, formula, source, grain and owner. Start with the ten metrics that appear most in the client report.
- 4.Write down which "conversion" each report uses (Google Ads primary action, GA4 key event, CRM lead) and don't mix definitions under the same name.
- 5.When comparing overall rates between campaigns, open the breakdown by device, placement or audience before moving budget.
- 6.If more than one tool reads the same data, move the formulas into a semantic layer and have dashboards and reports query from there.
Sources
- Google Ads Help: Clickthrough rate (CTR): Definition
- Google Ads Help: Conversion rate: Definition
- Google Ads Help: About primary and secondary conversion actions
- Google Ads Help: About "All conversions"
- Google Analytics Help: Conversions vs. key events in Google Analytics
- Google Analytics Help: Comparing metrics: Google Analytics vs. Universal Analytics
- Meta Business Help Center: About reach metrics
- Cube: Accelerating non-additive measures
- dbt Docs: Ratio metrics
- Looker Docs: Measure types
- Stanford Encyclopedia of Philosophy: Simpson's Paradox
About the author
João Vitor Moitinho
João Vitor Moitinho is the founder of Relator Digital. A computer engineer, he works on growth, measurement and martech, and writes here about what he learns building reports for performance agencies.
João Vitor Moitinho on LinkedInThis article is also available as Markdown, for agents and LLMs: view .md version